Investigators:
Lori Hunter (PI), Catherine Talbot, Helen Wilson-Burns, Dylan Connor
Funding:
NIA
Data sources:
- National Health Interview Survey (NHIS; this project required restricted data from the National Center for Health Statistics (NCHS), process here)
- FEMA disaster declaration summaries
- Spatial Hazards Events and Losses Database (SHELDUS) – contact XXXXX.
- nClimGrid data from NOAA’s National Center for Environmental Information (NCEI)
Measures:
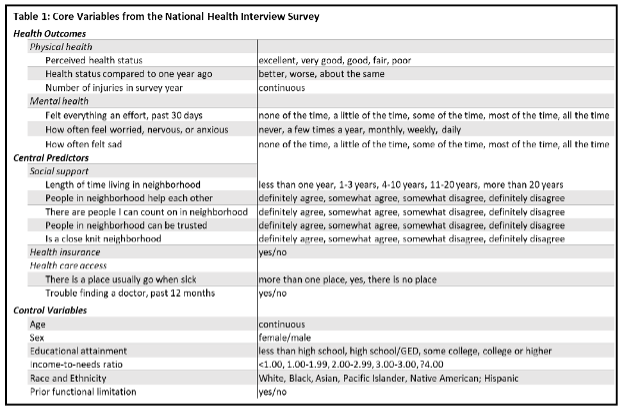
- Health Measures: Several measures of physical and mental health (table below).
- Aging Measures: Contrast health outcomes across age groups including 18-64 years and 65 years and over; also disaggregate into subcategories of younger and older individuals (e.g., 18-34, 75+).
- Climate Measures: Extreme events (FEMA, SHELDUS); precipitation and temperature anomalies; more details below.
Project Summary:
This project examines the physical and mental health impacts of extreme environmental events on the elderly, with an emphasis on how these impacts vary across the rural-urban continuum. Extreme environmental events — such as floods, wildfires, and hurricanes — are increasing in frequency and severity (Hayhoe et al. 2018) and rural residents are especially vulnerable given their lower levels of health insurance coverage (Cohen et al. 2021) and lesser access to health care. Physician density is much lower in rural areas (Machado et al. 2021) and ongoing hospital closures mean longer transport times, including for emergency care (GAO 2021). In fact, rural dwellers are already subject to the “rural mortality penalty” in that they already have lower life expectancies compared to their urban counterparts (Miller and Vasan 2021). We combine data on physical and mental health from the National Health Interview Survey, historical weather data, FEMA disaster declarations, and background on the scale and scope extreme environmental events and then link these to indicators of ruralness based on the USDA’s rural-urban continuum. We emphasize the connections between extreme environmental events and health for the rural elderly by contrasting the association for this group with that for younger individuals and urban dwellers. Of additional interest is the potential for social support and connection to be protective. In urban areas, social isolation has been found to play a role in mortality in disasters such as the loss of elderly life in the Chicago heat wave of 1995 (Klinenberg 2015). However, rural areas are characterized by relatively stronger social bonds (Henning-Smith et al. 2019) and we therefore examine the possibility of such connections benefiting the rural elderly in times of disaster. In all, this project provides information important for the development of programs and policies to protect elderly health in the context of rising environmental extremes.
Comments:
No locational data are available in the publicly available NHIS and, as a result, restricted data were required in order to integrate the data sources. The restricted data provide county location and the social and environmental data are integrated at the county scale.
Contrasts across rural and urban areas are central to the project, so we also include the USDA Economic Research Service’s “Rural-Urban Continuum Codes” (RUCC) that include 9 categories with 3 “metro” county classes and 6 “nonmetro” classes. Metro counties are divided into categories according to total population size of the metro area of which they are part, and nonmetro counties are categorized by the size of their urban populations and the county’s adjacency to one or more metro areas.
On the creation of the weather variables:
The data are integrated at the county scale, with temperatures and precipitation measures representing the average of values within a county. NOAA’s data are generated from 23,000 weather stations and vetted using National Research Council standards. Such data allow tremendous flexibility in creation of measures of stress including heat stressors that do not rise to the definition of heat waves (defined by the EPA as at least four days with an average temperature that would only be expected to persist over four days once every 10 years, based on the historical record). Similarly, measures can be created of precipitation anomalies that do not result in floods (defined by FEMA as partial or complete inundation of 2 or more acres or 2 more properties). The research team has made use of such weather data in prior scholarship where anomalies were indicated by 1 or 2 standard deviations from a long term normal (typically 30 years). We use such measures to identify extreme events in addition to the SHELDUS and FEMA disaster data.