
Tag: what am i reading

What am I Watching? CAFE University: Considerations for temperature in public health studies Auto Draft

What am I Watching? CAFE University: Considerations for temperature in public health studies 

Link to webinar

If you’re interested in contributing a short What Am I Reading post, we’d love to hear from you! Email us at cache@colorado.edu.

Written by Jenna Tipaldo and Deborah Balk, CUNY Institute for Demographic Research

Researchers interested in studying the impacts of temperature on health face decisions on how to operationalize and measure exposures. This webinar “CAFE University: Considerations for temperature in public health studies” by Lauren Mock and Shreya Nalluri explores the myriad choices required when using temperature data to study health outcomes, from choice of metric and dataset to the study design.  

The webinar includes an overview of various temperature metrics including land surface temperature (LST), air temperature (AT), heat index, wet bulb globe temperature (WGBT), and universal thermal comfort index (UTCI). A fuller discussion  about choice of metrics can be found in this resource from the World Resources Institute (Engel et al. 2025), also referenced in the webinar. (It is useful to note that these are all measures of outdoor temperature. Measurement of indoor vs outdoor exposure is explored in another post on air pollution). 

Each metric is more suited for specific purposes and contexts than for others, and each has drawbacks. For example, air temperature is widely available but doesn’t include factors that influence how humans perceive temperature, such as humidity. Both WGBT and UTCI do consider humidity.  

Other dataset considerations include the availability of multiple metrics such as daily maximums, minimums, or averages. (All of the metrics discussed in the webinar provide daily temperature resolution, but some sensors have more fine-grain temporal data, such as hourly. See Table below.)  

Additionally, researchers may choose to use raw temperature values versus standardized values such as percentiles, which can account for acclimatization.  

Source: CAFE University 

Another aspect of operationalizing exposure is considering the timing of exposure relative to an outcome of interest – the webinar gives an example of defining the exposure period as the day of, day prior to, or three days prior to an event.  

Even so, a recent paper (Cruz et al., 2025) proposes a framing of heat as a chronic phenomenon and argues that chronic exposures pose different risks that are not captured by existing research that evaluates the health impacts of acute exposures to extreme heat. 

The webinar also explores the use of several gridded temperature datasets, including ERA5, gridMET, and PRISM, and how to link these with health data (e.g., calculating zonal statistics and population-weighting).  

The webinar provides strengths, limitations, and use cases for each dataset, which vary in their spatial and temporal resolution, as well as the measurements that can be calculated using each dataset. For example, gridMET and PRISM have high-resolution daily averages but do not have the additional measurement components to calculate UTCI or WBGT. ERA5 has higher resolution temporally with hourly data but is coarser spatially and provides global coverage with components to calculate more metrics, including UTCI and WBGT. Though, the ERA5-Land data is not well-suited for coastal studies.  

In general, gridded data are also limited by the data underlying them, a point that was touched on but not explored in depth in the webinar.  It was noted that “gridded products inherit uncertainty from models and stations,” and these limitations are important to keep in mind when choosing a dataset and measures.   

Regardless of which dataset is used, another consideration is how the resolution of the temperature data compares to the resolution of the health or socioeconomic data or outcome of interest. Using spatial resolution as an example, when a researcher wants to integrate temperature data to an administrative unit (say, county or municipality) associated with health records or survey respondents’ residence, they may care whether the temperature grid data in question is more or less coarse than those administrative units. At mismatched spatial scales, there may be implications for errors in measurement or attribution when averaging temperature into the administrative units. As an example, the figure below shows gridMET and ERA5 data for the same day (July 31, 2025) in the Philadelphia, PA and surrounding NJ area.  Averaging across finer resolution data would likely be more suitable for finer-scale (smaller) units such as administrative units that represent urban areas and seen in the center of the figure below.  

Finer scale data may also be more suitable when within administrative unit variation in temperature is high, or the analyst wants to capture that variation. For coarser administrative units, if additional information such as where population is concentrated is not available, use of the coarser temperature data may be as suitable as finer-grained data, noting of course that any sub-unit variation over these administrative areas is simply unobserved (Porter & Howell, 2016) or was reallocated with ancillary data (Zoraghein and Leyk, 2018, Uhl et al. 2018).  

In the context of gridded population data, Leyk et al. (2019) provide a review of products available and a guide for understanding underlying data used in each gridded product, including the population data (spatial coarseness and how change over time is handled), use of ancillary data (such as settlements, roads or land cover), and methods used to allocate population within a defined grid “cell size”. All of these impact the suitability of use in particular applications. Fitness-for-use guidelines for these global population gridded dataset may depend on spatial and temporal resolution, scale and setting (rural vs urban), and mechanism of interest as noted in Leyk et al. (2019) and the same principles can act as a lens when evaluating which climate data set is most suitable for a given analysis.  

Materials from a CACHE demonstration project “Heat, Disability in older adults and Care” from El Colegio de Mexico provides code and guidance for calculating UTCI using ERA5 data, producing municipality-level estimates of number of severe heat days:   https://agingclimatehealth.org/severe-heat-days-using-the-universal-thermal-comfort-index/  


References 

Cruz, M., Mach, K. J., Turek-Hankins, L. L., Ashad-Bishop, K. C., Bailey, Z. D., Evans, S. D., Fanning, A., Fernandez-Burgos, M., Gilbert, J., Howard, B., Mahabir, M., Marturano, J., Murphy, L. N., Muse, N., Pérodin, J., & Clement, A. C. (2025). Where heat does not come in waves: A framework for understanding and managing chronic heat. Environmental Research: Climate4(2), 023002. https://doi.org/10.1088/2752-5295/adc827 


Engel, R. E. Mackres, M. Palmieri and E. Anzilotti (2025). Beyond the Thermometer: 5 Heat Metrics That Drive Better Decision-Making, World Resources Institute Insights March 17, 2025 https://www.wri.org/insights/beyond-thermometer-measuring-heat  


Leyk, S., Gaughan, A. E., Adamo, S. B., De Sherbinin, A., Balk, D., Freire, S., Rose, A., Stevens, F. R., Blankespoor, B., Frye, C., Comenetz, J., Sorichetta, A., MacManus, K., Pistolesi, L., Levy, M., Tatem, A. J., & Pesaresi, M. (2019). The spatial allocation of population: A review of large-scale gridded population data products and their fitness for use. Earth System Science Data, 11(3), 1385–1409. https://doi.org/10.5194/essd-11-1385-2019 


Porter, J. R., & Howell, F. M. (2016). A spatial decomposition of county population growth in the United States: Population redistribution in the rural-to-urban continuum, 1980–2010. In Recapturing space: New middle-range theory in spatial demography (pp. 175-198). Cham: Springer International Publishing. 

Uhl, J. H., Zoraghein, H., Leyk, S., Balk, D., Corbane, C., Syrris, V., & Florczyk, A. J. (2020). Exposing the urban continuum: implications and cross-comparison from an interdisciplinary perspective. International Journal of Digital Earth13(1), 22–44. https://doi.org/10.1080/17538947.2018.1550120  


Zoraghein, H., & Leyk, S. (2018). Enhancing areal interpolation frameworks through dasymetric refinement to create consistent population estimates across censuses. International Journal of Geographical Information Science32(10), 1948–1976. https://doi.org/10.1080/13658816.2018.1472267  


Continue reading

What am I reading: Sunny-day Floods and their Health Risks  

What am I reading? Sunny-day Floods and their Health Risks

Link to article

If you’re interested in contributing a short What Am I Reading post, we’d love to hear from you! Email us at cache@colorado.edu.

Written by Kathryn Foster, Cornell University 

As sea-level rise worsens the impacts of hurricanes and storm surges, it also leads to more frequent tidal and seasonal floods in coastal areas, commonly referred to as sunny-day, blue sky, or nuisance flooding. The annual number of days with sunny-day flooding has more than doubled since 2000, with projections that it will triple by 2050, averaging 45-85 days a year nationwide (NOAA, 2025). Current research, such as Mueller et al. (2024), is beginning to document the many impacts of sunny-day flooding and other types of flooding on residential health.  

Mortality: Research shows that in Florida, a 20-mm (0.79 in.) increase in tidal flooding depth raises mortality rates by 0.46% to 0.60% among adults 65 and older. Sea-level rise could contribute to an additional 130 elderly deaths annually in Florida relative to 2019 (Mueller et al. 2024).  

Similarly, longer-lasting floods have greater impacts on mortality than other types of floods, such as flash floods (Lynch et al., 2025). An increase in frequency and severity of seasonal tidal flooding could increase the risk of mortality by blocking roads to medical services, such as regular doctor’s appointments, pharmacies, and hospitals. Other research supports these conclusions, finding that with anticipated intensified flooding, elderly populations will become more vulnerable to morbidity and mortality risks, largely due to mobility constraints among aging adults (Paavola, 2017; Hu et al., 2018; Sheahan et al., 2025). The mortality effects of flooding primarily affect those who require at least 8.85 minutes to reach the nearest hospital (Mueller et al. 2024).  

Infectious Diseases: Seasonal tidal flooding may also increase the incidence of waterborne and infectious diseases in the United States. As flooding increases, communities are exposed to standing water around their homes for longer periods. Seasonal floods are strongly associated with increased hospitalizations for Legionnaire’s disease, a type of pneumonia caused by Legionella bacteria that grows in warm, moist climates (Lynch and Shaman 2022). Enteric infections may also arise from drinking water contamination and sewerage disruption (Carr et al., 2024; Wright et al., 2018), and mosquito-borne diseases and infections may occur from exposure to polluted flood waters (Wright et al., 2018).  

Previous research on coastal storms finds that these events are associated with the spread of certain infectious diseases, such as E. Coli, Legionnaires’, Cryptosporidiosis, Paratyphoid fever, and Dengue in certain areas (Lynch and Shaman 2023; Zheng et al., 2017). These studies similarly posit that the spread of infectious disease will increase alongside predicted increases in coastal storms due to climate change. Although not yet explicitly studied, researchers hypothesize that the spread of infectious diseases associated with coastal storms will also be linked to seasonal tidal flooding (Lynch and Shaman 2022). This provides ground for future research to examine how increasing tidal floods relate to the rise in infectious diseases, like that of coastal storms.   

Other Impacts: Furthermore, other hazards, such as snakebites and wound infections, may occur with tidal flooding and prolonged inundation of residential areas (Wright et al., 2018). Flooding increases residents’ exposure to venomous snakes, as snakes try to enter homes to find dry land or as water snakes are found in inundated streets, leading to a potential health hazard if bitten (Ochoa et al., 2018). Furthermore, as residents document having to walk through flooded streets during seasonal tidal flooding, wounds may become infected by the floodwater, or unseen hazards in the water may cause wounds (Wright et al., 2018). While these hazards are beginning to be documented, little research has examined their relationship to tidal flooding; future research could fill this gap by examining the association between reported snake bites and wound infections and tidal flooding.  

From Research to Policy: These studies highlight that the costs of climate change go beyond heat impacts, emphasizing that the increased frequency and severity of seasonal tidal flooding may directly affect residents’ health. Mueller and colleagues (2024) suggest that communities design programs to improve transportation options for the elderly during the sunny-day flooding season. Furthermore, other researchers suggest that public health initiatives should inform clinicians and residents alike about the health risks of seasonal flooding (Lynch and Shaman, 2022). Alongside public-health initiatives, more effective and equitable preparations for flood risk should be put in place to better mitigate seasonal flooding-related health risks, especially for elderly adults in these communities (Lynch et al., 2025). Such initiatives could include increasing flood-risk awareness by hosting community classes on flood preparation, stockpiling essential medical supplies (Yodsubana and Nuntaboot, 2021), coordinating resource and information sharing with government agencies, healthcare providers, and community groups for elderly residents (Madani Hosseini et al., 2024), and constructing seawalls and elevating roads to prevent road closures (Mueller et al., 2024).   

References:

Hu, P., Zhang, Q., Shi, P., Chen, B., & Fang, J. (2018). Flood-induced mortality across the globe: Spatiotemporal pattern and influencing factors. Science of the Total Environment, 643, 171-182. 

Lynch, V. D., & Shaman, J. (2022). The effect of seasonal and extreme floods on hospitalizations for Legionnaires’ disease in the United States, 2000–2011. BMC Infectious Diseases, 22(1), 550. 

Lynch, V. D., & Shaman, J. (2023). Waterborne infectious diseases associated with exposure to tropical cyclonic storms, United States, 1996–2018. Emerging infectious diseases, 29(8), 1548. 

Lynch, V. D., Sullivan, J. A., Flores, A. B., Xie, X., Aggarwal, S., Nethery, R. C., … & Parks, R. M. (2025). Large floods drive changes in cause-specific mortality in the United States. Nature Medicine, 31(2), 663-671.  

Madani Hosseini, M., Zargoush, M., & Ghazalbash, S. (2024). Climate crisis risks to elderly health: strategies for effective promotion and response. Health Promotion International, 39(2), daae031. 

Mahmoudi, S., Moftakhari, H., Muñoz, D. F., Radfar, S., Sweet, W., & Moradkhani, H. (2025). Escalating high tide flooding along the Atlantic and Gulf Coast of the United States due to sea level rise. Earth’s Future, 13(9), e2024EF005328. 

Mueller, V., Hauer, M., & Sheriff, G. (2024). Sunny-day flooding and mortality risk in coastal Florida. Demography, 61(1), 209-230. 

NOAA Office for Coastal Management High tide flooding.. (n.d.). https://coast.noaa.gov/states/fast-facts/recurrent-tidal-flooding.html#:~:text=Here%20are%20some%20statistics%20on%20high%20tide,inches%20(21%20to%2024%20centimeters)%20since%201880  

Paavola, J. (2017). Health impacts of climate change and health and social inequalities in the UK. Environmental Health, 16 (Suppl 1), 113. 

Wright, L. D., D’Elia, C. F., & Nichols, C. R. (2018). Impacts of coastal waters and flooding on human health. In Tomorrow’s Coasts: Complex and Impermanent (pp. 151-166). Cham: Springer International Publishing. 

Yodsuban, P., & Nuntaboot, K. (2021). Community-based flood disaster management for older adults in southern of Thailand: A qualitative study. International journal of nursing sciences, 8(4), 409-417. 

Zheng, J., Han, W., Jiang, B., Ma, W., & Zhang, Y. (2017). Infectious diseases and tropical cyclones in Southeast China. International journal of environmental research and public health, 14(5), 494. 

Continue reading

What Am I Reading? Evaluating How Extreme Weather Events Can Affect Health Care Utilization

What Am I Reading? Evaluating How Extreme Weather Events Can Affect Health Care Utilization

If you’re interested in contributing a short What Am I Reading post, we’d love to hear from you! Email us at cache@colorado.edu


Written by Sara Curran and June Yang, University of Washington

Research on disasters and health has increasingly leveraged linked administrative claims data and detailed spatial information on natural disaster events in order to move beyond single-case descriptions toward quasi-experimental designs. Such linkages aim to improve knowledge about the proximate mechanism (such as health care utilization) that link the consequence of disasters to health outcomes.  Such insights about the mechanisms can then help target improvements for resilience and adaptation in the future. For example, a recent study of Puerto Rico integrated private insurance claims and beneficiary counts from multiple insurers to construct harmonized region–year indicators of infectious disease, injury, and mental health service use, and then interpreted abrupt shifts in these indicators around hurricanes, earthquakes, and the COVID-19 pandemic as signatures of disaster-related disruption to health care access and need (Stimpson et al., 2025).  Building on the same logic of combining high-resolution utilization data with externally defined measures of hazard exposure and loss, another study links national Medicare fee-for-service claims with standardized disaster databases to estimate the short-term effects of extreme weather events on morbidity and mortality across U.S. counties (Salas et al., 2024).  We summarize each article here and then offer a few suggestions for future research.

Stimpson et al. (2025) innovatively developed a harmonized repeated, cross-sectional insurance claims dataset from 2016-2022 in Puerto Rico. The aggregated data included information from each region and year about injuries, infectious diseases, mental health, and substance use claims and was standardized by the number of beneficiaries per region and year.  The annual trend lines for each type of claims category are descriptively evaluated for each region.  Following Hurricane Maria, they find in the affected regions larger or higher increases in claims related to infectious disease, injury, mental health, and substance use.  Regions that were less impacted by Hurricane Maria showed lower rates of claims across all types.  The authors argue that the data point to the need for targeted interventions to enhance overall infrastructure, especially health care infrastructure for improved health outcomes.  The Stimson et al. study is a good example of creatively generating valuable evidence from insurance claims data to descriptively observe trends and patterns. The limitations of the study’s results are in the relatively small number of cases (region-year), making it impossible to statistically evaluate whether the differences are significant.   

With a similar motivation for attention to study design, a recent article by Renee Salas and colleagues published in Nature Medicine creatively links NOAA and SHELDUS (Spatial Hazards and Economic Loss Data in the US) to Medicare fee-for-services administrative data to evaluate the impact of extreme weather events on health outcomes. The study examines counties impacted by at least one of 42 NOAA-identified, extremely damaging events (damages a total value of US$ 1 billion or higher), occurring between 2011 and 2016, and seeks to understand whether health outcomes changed in unaffected and affected counties before and after the event.  They use the SHELDUS data to identify county-level damages for affected counties (the property and crop damages for those affected counties ranges between $3,220-$12.51 billion per county).  Combined with the CMS data at the county-level they systematically compare affected and non-affected counties.  This valuable quasi-experimental design offers a careful comparison across time evaluating impacts the week following a disaster, 1-2 weeks after, and 3-6 weeks after. These spatial and temporal comparisons across the entire country, offer an important national assessment of the immediate and lagged health outcome effects of severe weather events.  Notably, the study limits itself to floods, severe storms, and winter storms, which, they argue, are events that are relatively short-lived, destroy infrastructure, and can have lingering social and built environment effects.  They contrast these events to wildfire and droughts which often last for hundreds of days and have somewhat different impacts on infrastructure, so the authors do not evaluate these types of events and also exclude counties experiencing them from eligibility in the selection of matched control counties. They make two sets of comparisons.  First, they compare the relative change in health outcomes in affected counties before and after events.  Second, they compare similar counties with and without exposure to the event using a difference-in-difference estimation.  They find similar results with both types of comparisons.

Fig. 2: Forest plots of ED visit and mortality relative change and DID for affected counties in post-disaster weeks 1–2 and weeks 3–6 in Medicare beneficiaries exposed to a short-term NOAA NCEI billion-dollar weather disaster in the United States. (Salas et al., 2024)

Winter storms and tropical cyclones are most damaging to health outcomes 

Their most important findings are summarized in their Figure 2.  They show how emergency department visits and mortality are significantly increased by severe events.  In Panel a. emergency department visits are significantly higher in the first two weeks following a severe event, but not so in the weeks 4 or more.  Most of these differences are driven by severe winter storms and tropical cyclones. In Panel b. mortality is significantly higher across all time lags.  This mortality effect is primarily driven by severe storm events.  Not shown in Figure 2, but discussed elsewhere, is the finding that non-elective hospitalizations remained unchanged over all types of severe storms and all the time lags.  Besides demonstrating how particular types of severe events cause significant increases in emergency department visits and mortality, they also show that among storms totaling more than 1 US $ Billion in damages overall, the most expensive storm events are the ones driving the results (those in the upper quartile of counties (damages ranging between $622.66K-12.51B)).

This analyses and the linked data, together with Stimpson et al. (2025) study, suggest many useful avenues for further research that could leverage routinely collected administrative and claims data to understand the more precise and proximate mechanisms of health care utilization and costs of disasters on the US economy and health, and well-being of the US population. Future work can build on these designs to probe the mechanisms that generate vulnerability, such as pre-existing comorbidities, healthcare access barriers, and disruptions to utilities or transportation, and to identify which communities are more, or less resilient in the face of weather shocks.

Both studies reviewed here highlight the importance of understanding crucial heterogeneity of geography and preparedness impacting health care needs and capacities: for example, winter storms may be especially deadly in places like Texas where infrastructure and housing are optimized for heat rather than cold. Such geographic variation almost certainly intersects with social disadvantage, race, income, and other axes of inequality, suggesting that analyses that explicitly consider these overlapping vulnerabilities in relation to hazard exposure, built environment, and structural conditions are a critical next step. By expanding this line of inquiry to additional disaster types and contexts, researchers can generate evidence that not only clarifies patterns of risk, but also informs theory and policy on the social determinants of disaster vulnerability, resilience, and health system performance.

For those interested, code for Salas et al. (2024) is available at GitHub and can be found at https://github.com/Billion-Dollar-Weather-Medicare/ED-Hospitalizations-Mortality/.

Notes about administrative data:

“Administrative data” here means records generated during the routine administration of healthcare and insurance, for example, billing/claims files, enrollment and beneficiary summary files, and facility or provider administrative records. These datasets are not collected for research, but capture large populations and longitudinal events (visits, diagnoses, procedures, dates and place of care), which makes them powerful for measuring changes in utilization, costs, and short-term outcomes after disasters, while also carrying limitations (limited clinical detail, timing/coverage constraints, and privacy/regulatory restrictions).

Salas et al. (2024) used fee-for-service Medicare administrative claims and beneficiary files to measure ED visits, hospitalizations, and mortality after billion-dollar weather disasters (these Medicare files are controlled by Center for Medicare & Medicaid Services and cannot be redistributed by the authors).  Stimpson et al. (2025) analyzed private insurance claims for Puerto Rico obtained through the territory’s Office of the Commissioner of Insurance, illustrating how regulator-level aggregates from insurers can be used to study regional patterns after consecutive disasters.

References 

  • Salas, Renee, Laura Burke, Jessica Phelan, Gregory Wellenius, E. John Orav, & Ashish Jha. 2024. “Impact of Extreme Weather Events on Healthcare Utilization and Mortality in the U.S.” Nature Medicine  https://doi.org/10.1038/s41591-024-02833-x

    • Stimpson, Jim P., Damaris Lopez Mercado, Alexandra C. Rivera-González, Jonathan Purtle, and Alexander N. Ortega. 2025. “A Regional Analysis of Healthcare Utilization Trends during Consecutive Disasters in Puerto Rico Using Private Claims Data.” Scientific Reports 15(1):5249. doi:10.1038/s41598-025-89983-1.

        Continue reading

        What Am I Reading? Studying Environmental Hazards and Health in Older Adults: Use of the Health and Retirement Study

        What Am I Reading? Studying Environmental Hazards and Health in Older Adults: Use of the Health and Retirement Study

        Link to article

        If you’re interested in contributing a short What Am I Reading post, we’d love to hear from you! Email us at cache@colorado.edu.

        Written by Jenna Tipaldo, CUNY School of Public Health and CUNY Institute for Demographic Research, jenna.tipaldo09@sphmail.cuny.edu

        November 2025

        The Health and Retirement Study (HRS) is an ongoing longitudinal study of middle-aged and older adults. It is designed to be nationally-representative of the U.S. population over age 50 and it adds a new cohort every six years. The HRS presents an excellent opportunity to study life course exposures and health outcomes in older adults. Many researchers have used the HRS to investigate the impacts of environmental exposures, including disasters (Bell et al., 2019; Brilleman et al., 2017), heat (Choi et al., 2023; Choi & Ailshire, 2025), air pollution (Van Dang et al., 2025; Zhang et al., 2023), and greenspace (Fossa et al., 2024).  

        Several features of the HRS study design make it well suited for studies of environmental exposures and health outcomes. As a study that follows participants (and their spouses) until death, the HRS has detailed longitudinal information about participants. The study has high response panel rates, consistently over 85% until 2016 (HRS Staff, 2025). When participants do not response, the HRS staff make an effort to determine whether a participant is still living or has died. Among participants who have died, there is an attempt to conduct an exit interview with someone close to the participant such as a spouse or child. The HRS fields a core survey every two years, which includes questions regarding health and demographic variables. In off-years, additional surveys are fielded, including the Life History questionnaire that covers a respondent’s history before age 50. There are many cross-wave and longitudinal files, including the RAND Longitudinal file, that combine the many waves of surveys that lower barriers for longitudinal analyses. It is also notable that there are many “sister studies” to the U.S. HRS, which are catalogued in the “Gateway to Global Aging Data repository” </from many countries around the world.</

        The HRS can be linked with data that can help determine exposure to environmental hazards. Using geographic detail that is accessible via a restricted data enclave, researchers can link external datasets with HRS survey responses to assess environmental exposures and associated outcomes. Via the Geographic Linkages Repository and HRS Contextual Data Resource Series, the HRS team even makes available linkages with several datasets created by various research teams including the many resources in the National Neighborhood Data Archive (NaNDA).  </

        In addition to weather data from weather stations and PRISM (Parameter-elevation Regressions on Independent Slopes Model), this resource can also provide the context about a respondent’s Census tract, for example, such as land use, polluting sites, urbanicity, as well as socioeconomic and demographic characteristics. Dick (2022) provides a review of the HRS Contextual data resources.  

        A great resource for researchers new to the Health and Retirement Study is Amanda Sonnega’s guide, “Using HRS Data: A Guide for New Users.” </

        The materials include a document with an overview of the study design, survey content, available data products, how to access data, and guidance for data analysis. In addition, the guide points to code examples, which are available in four programming languages (R, SAS, STATA, and SPSS) and provide sample code for common steps in analysis of HRS data such as merging files, transforming data between wide and long formats, and using survey weights. The Gateway to Global Aging Data repository also has guides for researchers interested in conducting cross-country studies.  

        Looking for CACHE’s description of the coding guide? Find it here. 

        References 

        • Bell, S. A., Choi, H., Langa, K. M., & Iwashyna, T. J. (2019). Health Risk Behaviors after Disaster Exposure Among Older Adults. Prehospital and Disaster Medicine, 34(1), 95–97. doi:https://doi.org/10.1017/S1049023X18001231 
        • Brilleman, S. L., Wolfe, R., Moreno-Betancur, M., Sales, A. E., Langa, K. M., Li, Y., Daugherty Biddison, E. L., Rubinson, L., & Iwashyna, T. J. (2017). Associations between community-level disaster exposure and individual-level changes in disability and risk of death for older Americans. Social Science & Medicine (1982), 173, 118–125. J Glob Health. 2024;14:04101. doi:10.1016/j.socscimed.2016.12.007 
        • Choi, E. Y., & Ailshire, J. A. (2025). Ambient outdoor heat and accelerated epigenetic aging among older adults in the US. Science Advances, 11(9), eadr0616. doi:10.1126/sciadv.adr0616 
        • Choi, E. Y., Lee, H., & Chang, V. W. (2023). Cumulative exposure to extreme heat and trajectories of cognitive decline among older adults in the USA. Journal of Epidemiology and Community Health, 77(11), 728–735. doi:10.1136/jech-2023-220675 
        • Dick, C. (2022). The Health and Retirement Study: Contextual Data Augmentation. Forum for Health Economics and Policy, 25(1-2), 29-40. doi:10.1515/fhep-2021-0068 
        • Fossa, A. J., D’Souza, J., Bergmans, R. S., Zivin, K., & Adar, S. D. (2024). Different types of greenspace within urban parks and depressive symptoms among older U.S. adults living in urban areas. Environment International, 192, 109016. doi:10.1016/j.envint.2024.109016 
        • Van Dang, K., Choi, E. Y., Crimmins, E., Finch, C., & Ailshire, J. (2025). The Joint Effects of Exposure to Ambient Long-term Air Pollution and Short-term Heat on Epigenetic Aging in the Health and Retirement Study. The Journals of Gerontology, Series A: Biological Sciences and Medical Sciences, 80(7), glaf092. doi:10.1093/gerona/glaf092 
        • Zhang, B., Langa, K. M., Weuve, J., D’Souza, J., Szpiro, A., Faul, J., Mendes De Leon, C., Kaufman, J. D., Lisabeth, L., Hirth, R. A., & Adar, S. D. (2023). Hypertension and Stroke as Mediators of Air Pollution Exposure and Incident Dementia. JAMA Network Open, 6(9), e2333470. doi:10.1001/jamanetworkopen.2023.33470  

        Continue reading

        What Am I Reading: Disasters and Aging in Place

        What am I reading? Disasters and Aging in Place

        Link to article

        If you’re interested in contributing a short What Am I Reading post, we’d love to hear from you! Email us at cache@colorado.edu

        Written by Jenna Tipaldo, CUNY School of Public Health and CUNY Institute for Demographic Research, jenna.tipaldo09@sphmail.cuny.edu

        A new report from Winkler & Mockrin (2025) entitled “Aging and wildfire risk to communities” explores the exposure of older populations to wildfires. A main findings is that “Nearly all (87 percent) of the population growth in higher wildfire risk locations between 2010 and 2020 was among people over the age of 60, many of whom had been living in higher risk places for years and are growing older (i.e., aging in place).” Each is relevant when thinking about older adults and exposure, vulnerability, and resilience to disasters.  Wildfires are just one of type of disaster to consider: recent evidence also suggests that coastal zones – areas at risk of storms and other seaward hazards such as flooding and tsunamis – are also aging faster than areas farther inland (Bukvic et al., 2018; Hauer et al., 2020; Tagtachian and Balk, 2023). 

        No relocation: Forsyth & Molinsky (2020) note that to some, aging in place signifies remaining in their home while to others it may mean moving but within the same community, such as downsizing. Based on recent shifts in age distribution in Census blocks with “moderate-to-high” wildfire risk, Winkler & Mockrin (2025) conclude that the increase in older adult populations in fire-prone regions is likely attributable to populations aging in place rather than in-migration (Figure 4). They also note important spatial variation and also uncertainty about the relative contributions of migration and death. They also note that aging in place seems to be the “primary mechanism” in higher risk rural areas (Winkler & Mockrin, 2025). 

        Source: Winkler & Mockrin (2025)

        Health and Health Care : Winkler & Mockrin (2025) summarize the various ways in which older adults can be at higher risk due to wildfires including 1) physical limitations that are barriers to preparation or response, 2) factors like social isolation which can impact access to information and resources, and 3) higher rates of chronic diseases which are risk factors for adverse health outcomes due to fires and smoke. Furthermore, disasters can be disruptive to healthcare, not only by damaging facilities and displacing people from their homes but also by disrupting care which relies on movement. Examples include when patients are unable to travel to hospitals or medical providers, or if healthcare workers can‘t get to a patient’s home due to inaccessible roads (Tarabochia‐Gast et al., 2022) or suspended public transit systems. Rural areas face additional challenges with longer travel times for healthcare access, especially with high levels of hospital closures (Miler et al., 2020; McCarthy et al., 2021). Such patterns negatively impact health care access, emergency medical response, and transport times (GAO, 2021; Kaufman et al., 2016). On average, rural residents must travel about 20 miles farther for typical health care services – in non-disaster times (GAO 2021). While those miles may seem trivial, in emergencies they can mean loss of access to care and treatment. 

        Personal choice: Aging in place can be a personal choice in support of maintaining one’s agency and independence by staying in one’s own home and community (Forsyth & Molinsky, 2020). Even so, staying in one’s home can also result from lack of choice due to limited resources and/or few desirable and affordable options. Modifications are expensive too. Even older adults who are relatively better off can struggle to pay for downsizing or modifying a new dwelling for care needs (Forsyth & Molinsky, 2020).  

        From research to policy 

        To help support healthy aging in place, Winkler & Mockrin (2025) suggest that existing programs that support older adults could be expanded to include wildfire risk reduction. An example is the USDA’s Section 504 Home Repair program which supports older low-income homeowners. In addition, organizations such as the AARP provide useful material for aging in place such as a checklist for people who are prepping their home. Such resources should be expanded to include disaster risk as a consideration.  


        References:  

        • Bukvic, A., Gohlke, J., Borate, A., and Suggs, J. 2018. “Aging in Flood-Prone Coastal Areas: Discerning the Health and Well-Being Risk for Older Residents.” International Journal of Environmental Research and Public Health 15(12):2900. https://doi.org/10.3390/ijerph15122900.   
        • Hauer, Mathew E., Elizabeth Fussell, Valerie Mueller, Maxine Burkett, Maia Call, Kali Abel, Robert McLeman, and David Wrathall. 2020. “Sea-Level Rise and Human Migration.” Nature Reviews Earth & Environment 1(1):28–39. https://doi.org/10.1038/s43017-019-0002-9 
        • Kaufman, B.G., Thomas, S.R., Randolph, R.K., et al. The rising rate of rural hospital closures. The Journal of Rural Health. 2016;32(1):35-43. https://doi.org/10.1111/jrh.12128  
        • McCarthy, S., Moore, D., Smedley, W. A., Crowley, B. M., Stephens, S. W., Griffin, R. L., Tanner, L. C., & Jansen, J. O. (2021). Impact of Rural Hospital Closures on Health-Care Access. Journal of Surgical Research, 258, 170–178. https://doi.org/10.1016/j.jss.2020.08.055 
        • Miller, K.E.M., James, H.J., Holmes, G.M., Van Houtven, C.H. The effect of rural hospital closures on emergency medical service response and transport times. Health Serv Res. 2020;55(2):288-300. https://doi.org/10.1111/1475-6773.13254  
        • Tagtachian, D. and Balk, D., 2023. Uneven vulnerability: characterizing population composition and change in the low elevation coastal zone in the United States with a climate justice lens, 1990–2020. Frontiers in Environmental Science, 11, p.1111856. 
        • Tarabochia‐Gast, A. T., Michanowicz, D. R., & Bernstein, A. S. (2022). Flood Risk to Hospitals on the United States Atlantic and Gulf Coasts From Hurricanes and Sea Level Rise. GeoHealth, 6(10), e2022GH000651. https://doi.org/10.1029/2022GH000651 
        • Winkler, R. L., & Mockrin, M. H. (2025). Aging and wildfire risk to communities (Report No. EIB-284). U.S. Department of Agriculture, Economic Research Service. https://doi.org/10.32747/2025.9015828.ers 


        Continue reading

        What am I Reading? Disentangling the Impacts of Extreme Heat on Biological Aging: Measuring the Hidden Toll on Our Body

        What am I reading? Disentangling the Impacts of Extreme Heat on Biological Aging: Measuring the Hidden Toll on Our Body

        Link to article

        If you’re interested in contributing a short What Am I Reading post, we’d love to hear from you! Email us at cache@colorado.edu.

        Written by Eun Young Choi, Postdoctoral Associate, University of Southern California

        High temperatures are heating not only our neighborhoods and homes, but also our very biology, as we suggested in a recent study (Choi & Ailshire, 2025). Among the many ways extreme heat threatens public health, its subtle yet significant impact on the body’s aging processes has begun to draw attention. I’ve been exploring how we can quantify the biological consequences of extreme heat, and why these hidden impacts matter for aging research.

        Why Focus on Biological Aging?

        Much of the climate-health literature has understandably focused on observable health outcomes: hospitalizations, respiratory and cardiovascular diseases, and death (Bunker et al., 2016; Hajat et al., 2010). These are essential indicators, but the effects of extreme heat might not immediately manifest as diagnosable conditions; instead, they may exert a silent toll at the cellular and molecular level. Over time, this biological strain can accumulate, increasing the risk of disability and disease. Biological age, measured using biomarkers that reflect physiological wear and tear, offers a promising way to identify early signs of changes in the body before chronic conditions are formally diagnosed. These include measures based on clinical biomarkers, cellular markers, and, more recently, molecular signatures such as DNA methylation (Chen et al., 2023 for review). Each of these tools provides a useful lens into how the aging process may advance more rapidly than expected based on chronological age, and how it may be shaped by external stressors like heat. Recent studies show that accelerated biological aging is associated with elevated risk of cardiovascular disease, cognitive decline, and mortality (Emami et al., 2022; Fransquet et al., 2019; Zhou et al., 2022). As such, these clocks provide a useful intermediate endpoint that can be particularly valuable when studying environmental exposures, which often unfold gradually and exert diffuse effects across multiple body systems. In this context, biological age can help us understand not just whether heat is harmful, but how it does its damage.

        How Do We Measure Heat?

        Measuring exposure to extreme heat may appear straightforward, but it involves multiple layers of complexity. The most common metric is ambient temperature (technically, the temperature in the surrounding environment), but even this can be defined in various ways—daily maximums, minimums, or averages—and it usually refers to outdoor air temperature. Others use composite indices that better approximate heat stress on the human body. The Heat Index, for example, incorporates humidity and is used to estimate heat-related stress in shaded environments (National Weather Service). The Wet-Bulb Globe Temperature (WBGT) goes further by accounting for wind speed, cloud cover, and sun angle as well to reflect conditions in direct sunlight, making it especially relevant for outdoor or occupational settings. Each of these measures captures different aspects of thermal stress, and the choice of metric should align with the study’s research question and target population. In our study, we used the Heat Index because our sample consisted of older adults, who are generally less likely to work outdoors or spend extended time in full sun. While these metrics can technically be measured indoors, they are typically based on outdoor weather data and do not directly reflect indoor conditions.

        How Can We Conceptualize Outdoor Heat Exposure to Better Estimate Health Impacts?

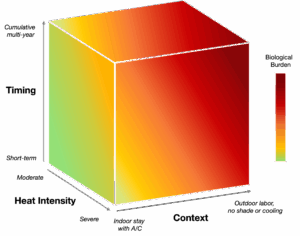
        Researchers have considered a variety of factors to understand the magnitude of heat-related health effects. Here, I created a conceptual cube with three axes to synthesize commonly used dimensions: exposure timing, heat intensity, and exposure context. This framework is not a modeling tool, but rather a way to clarify how different features of outdoor heat exposure interact to shape physiological burden.

        • Y-axis: What timeframe is captured?

        Exposure can occur over various timeframes: a single hot day, a multi-day heatwave, or repeated seasonal exposures over years. Short-term heat events can trigger immediate physiological stress responses (e.g., inflammation), while longer-term exposure to elevated temperatures may produce cumulative biological wear and tear. Studies use various time windows to model these effects, from several day lags to multi-year averages, depending on the health outcome of interest. While short-term physiological responses to heat stress may be transient, some effects may accumulate over time and this continuous exposure may leave biological imprints detectable by biomarker-based measures. For example, our findings show consistent associations between longer-term heat exposure (e.g., 1-year and 6-year cumulative heat days) and accelerated epigenetic aging, consistent with prior studies reporting robust associations and large effect sizes for longer-term heat exposure (Chiu et al., 2024; Ni et al., 2023).

        • Z-axis. How severe is the exposure?

        This axis represents the intensity of the heat experienced. Researchers use both relative and absolute metrics to define extreme heat. Relative measures, such as temperatures above the 95th percentile of the local historical distribution, are useful for identifying deviations from the norm, especially considering that long-term sublethal heat can lead to physiological adaptations and increased thermal tolerance (Carr et al., 2024; Périard et al., 2016). In contrast, absolute thresholds (e.g., >95°F or >35°C) provide a fixed reference point that can be useful for identifying biologically hazardous temperatures and facilitating comparisons across regions. For the Heat Index, for example, the National Weather Service offers a practical classification: 80°F (Caution), 90°F (Extreme Caution), and 103°F (Danger). The choice between relative and absolute measures should be guided by the study’s objective, the population’s vulnerability, and the geographic and climatic context.

        • X-axis. How is exposure experienced?

        This axis reflects the context: the individual or situational factors that influence how ambient heat translates into actual personal exposure. Most studies use outdoor temperature data from weather stations or modeled products, and these measures may not fully capture personal exposure – a challenge also seen in air pollution research, where ambient data often serve as proxies for individual exposure (see related discussion). It is therefore important to interpret such data as approximating the potential for exposure rather than direct experience. Key contextual modifiers include time spent outdoors, occupational exposure, housing quality, and access to cooling resources. For instance, older adults living in poorly insulated homes without air conditioning may experience disproportionately high indoor heat, despite similar ambient temperatures. Recent work has also highlighted substantial within-neighborhood variation in heat exposure, reinforcing the need to consider behavioral and environmental mediators when interpreting ambient heat metrics (Li et al., 2023; Reid et al., 2009).

        The color gradient in the figure reflects increasing physiological burden, illustrating how these dimensions can intersect to magnify biological stress. For instance, someone who works outdoors (high context), over many years (longer timing), and in areas where temperatures regularly exceed 100°F (high intensity), may experience substantially greater heat-related aging than someone briefly exposed to moderate heat while indoors.

        What We Found about Heat and Epigenetic Aging

        There is growing evidence from animal studies that heat stress can trigger epigenetic alterations such as DNA methylation, positioning these molecular changes as a plausible biological mechanism linking environmental exposures to long-term health outcomes (Murray et al., 2022). Epigenetic clocks—biological age estimates derived from DNA methylation levels across the genome—can capture cumulative physiological responses to stress and toxins. In our work, we’ve begun to apply these epigenetic measures to understand how outdoor heat exposure may accelerate epigenetic aging. Our findings show that outdoor heat, especially long-term, was significantly associated with greater acceleration in epigenetic age in a diverse national cohort of older adults. These associations persisted even after adjusting for individual-level socioeconomic and behavioral factors, as well as community-level characteristics. Taken together, these findings suggest that chronic heat exposure may not only increase immediate health risks but also disrupt key systems contributing to a steeper trajectory of epigenetic aging, potentially through pathways involving oxidative stress, inflammation, and metabolic reprogramming (Murray et al., 2022). Nonetheless, further evidence is needed to clarify the specific mechanisms linking heat exposure to epigenetic aging acceleration.

        Moving Forward

        Advancing this research requires embracing the complexity of both exposures and outcomes. On the exposure side, we must better account for co-occurring environmental stressors. Heat rarely acts alone. For instance, air pollution tends to worsen on hot days, creating compound exposures that may have synergistic effects on biological systems. We also need more attention to contextual variation, how housing, neighborhood infrastructure, and access to cooling resources shape actual heat burden experienced by older adults. This is especially pressing in low-income or racially marginalized communities, where systemic disinvestment may amplify risk. On the outcome side, biological aging is multidimensional. While epigenetic clocks help pinpoint biological responses to heat across systems, they capture only part of the picture. It remains unclear how—and to what extent—heat stress affects specific systems such as the immune, neuro, metabolic, cardiovascular, and renal systems in large human samples. Integrating additional biomarkers such as inflammatory cytokines, neurodegenerative markers, and metabolomic signatures can help build a more comprehensive understanding of how heat “ages” us biologically.

        Final Reflections

        Extreme heat is no longer exceptional—it is a defining feature of our climate reality. To understand its full toll on aging populations, we must look beyond acute events and capture the long-term, cumulative effects of chronic stress. Biological aging measures offer an important window into these processes, enabling earlier detection, monitoring of intervention impacts, and deeper insight into vulnerability. But how we measure exposure and aging matters. Choices about metrics and methods shape our conclusions—and our ability to act. Integrating high-resolution environmental data with multidimensional biomarkers will be key to building a fuller picture of how climate shapes the aging process.

        References

        Choi EY, Ailshire JA. Ambient outdoor heat and accelerated epigenetic aging among older adults in the US. Sci Adv. 2025;11(9):eadr0616. doi:10.1126/sciadv.adr0616

        Bunker A, Wildenhain J, Vandenbergh A, et al. Effects of Air Temperature on Climate-Sensitive Mortality and Morbidity Outcomes in the Elderly; a Systematic Review and Meta-analysis of Epidemiological Evidence. eBioMedicine. 2016;6:258-268. doi:10.1016/j.ebiom.2016.02.034

        Hajat S, O’Connor M, Kosatsky T. Health effects of hot weather: from awareness of risk factors to effective health protection. The Lancet. 2010;375(9717):856-863. doi:10.1016/S0140-6736(09)61711-6

        Chen R, Wang Y, Zhang S, et al. Biomarkers of ageing: Current state-of-art, challenges, and opportunities. MedComm – Future Medicine. 2023;2(2):e50. doi:10.1002/mef2.50

        Emami M, Agbaedeng TA, Thomas G, et al. Accelerated Biological Aging Secondary to Cardiometabolic Risk Factors Is a Predictor of Cardiovascular Mortality: A Systematic Review and Meta-analysis. Canadian Journal of Cardiology. 2022;38(3):365-375. doi:10.1016/j.cjca.2021.10.012

        Fransquet PD, Wrigglesworth J, Woods RL, Ernst ME, Ryan J. The epigenetic clock as a predictor of disease and mortality risk: a systematic review and meta-analysis. Clin Epigenet. 2019;11(1):1-17. doi:10.1186/s13148-019-0656-7

        Zhou A, Wu Z, Zaw Phyo AZ, Torres D, Vishwanath S, Ryan J. Epigenetic aging as a biomarker of dementia and related outcomes: a systematic review. Epigenomics. 2022;14(18):1125-1138. doi:10.2217/epi-2022-0209

        National Weather Service, Wet Bulb Globe Temperature vs Heat Index. https://www.weather.gov/ict/WBGT.

        Chiu KC, Hsieh MS, Huang YT, Liu CY. Exposure to ambient temperature and heat index in relation to DNA methylation age: A population-based study in Taiwan. Environment International. 2024;186:108581. doi:10.1016/j.envint.2024.108581

        Ni W, Nikolaou N, Ward-Caviness CK, et al. Associations between medium- and long-term exposure to air temperature and epigenetic age acceleration. Environment International. 2023;178:108109. doi:10.1016/j.envint.2023.108109

        Deborah Carr, Giacomo Falchetta, Ian Sue Wing, Population Aging and Heat Exposure in the 21st Century: Which U.S. Regions Are at Greatest Risk and Why?, The Gerontologist, Volume 64, Issue 3, March 2024, gnad050, https://doi.org/10.1093/geront/gnad050

        Périard JD, Travers GJS, Racinais S, Sawka MN. Cardiovascular adaptations supporting human exercise-heat acclimation. Autonomic Neuroscience. 2016;196:52-62. doi:10.1016/j.autneu.2016.02.002

        Li A, Toll M, Bentley R. Mapping social vulnerability indicators to understand the health impacts of climate change: a scoping review. The Lancet Planetary Health. 2023;7(11):e925-e937. doi:10.1016/s2542-5196(23)00216-4

        Reid CE, O’Neill MS, Gronlund CJ, et al. Mapping Community Determinants of Heat Vulnerability. Environ Health Perspect. 2009;117(11):1730-1736. doi:10.1289/ehp.0900683

        Murray KO, Clanton TL, Horowitz M. Epigenetic responses to heat: From adaptation to maladaptation. Experimental Physiology. 2022;107(10):1144-1158. doi:10.1113/EP090143

        Continue reading

        What Am I Watching? Understanding the Health Impacts of Wildfire Smoke Exposure

        What am I Watching? Understanding the health impacts of wildfire smoke exposure

        Link to video recording

        If you’re interested in contributing a short What Am I Reading post, we’d love to hear from you! Email us at cache@colorado.edu.

        Written by Elizabeth Sorensen Montoya, Ph.D. University of Colorado Boulder  www.elizabethsorensenmontoya.com

        If you live in the Eastern U.S. or the Midwest, you’ve probably spent the last few days breathing in that now-familiar sign of summer: Canadian wildfire smoke. But this isn’t just a North American problem. In recent years, wildfires have become more frequent, more intense, and harder to suppress. Because wildfire smoke can travel long distances, the health impacts often reach far beyond the burn zone.  

        So, what does all this smoke actually mean for our health? 
         
        As part of the Climate and Health Research Coordinating Center’s (CAFÉ RCC) State of the Science webinar series, Dr. Michael Brauer, professor at the School of Population and Public Health at the University of British Columbia, delivered an excellent talk exploring just that. You can watch the full seminar here. 
         
        Below is a quick, high-level overview of some key takeaways from the presentation: 

        • The “new normal”: Wildfires are becoming more frequent, larger, and harder to suppress. Not only that, but they’ve begun to extend beyond what we have traditionally thought of as “fire season”, with smoke events occurring well outside traditional summer months. 
        • Health impacts: The talk covered a wide range of health outcomes linked to wildfire smoke exposure, from respiratory and cardiovascular impacts to emerging evidence on effects like dementia, reduced cognitive performance, and ambulance dispatches. A particularly interesting piece of the talk focused on recent research into the delayed impacts of wildfire smoke. For example, one study by Landguth and colleagues shows that smoke exposure during the summer can increase the risk of flu during the following winter.  
        • Looking ahead: Dr. Brauer talked about how wildfire smoke could change in the years to come, not only as a result of climate change but also our response to it. 
        • What can be done? Dr. Brauer ended the talk by outlining several approaches for reducing exposure, from individual-level interventions to community-level planning and preemptive actions.  

        The seminar is well worth watching in full. Dr. Brauer does a fantastic job of weaving together scientific evidence, real-world case studies, and forward-looking perspectives.  

        As wildfires continue to affect communities around the world, it’s increasingly important to understand the health risks and how we might reduce them. Dr. Brauer’s talk is a great starting point for those curious about wildfire smoke and health and a valuable resource for those already working in that field.    


        References: 

        Brauer, M. (2024) Understanding the health impacts of wildfire smoke exposure. Presented as part of the CAFÉ RCC State of the Science webinar series, 15 May. Available at: https://www.youtube.com/watch?v=2CViMQ-Xjuo 

        Landguth, E.L., Holden, Z.A., Graham, J., Stark, B., Mokhtari, E.B., Kaleczyc, E., Anderson, S., Urbanski, S., Jolly, M., Semmens, E.O. and Warren, D.A., 2020. The delayed effect of wildfire season particulate matter on subsequent influenza season in a mountain west region of the USA. Environment international, 139, p.105668. 

        Continue reading

        What Am I Reading: Measuring Indoor Air Pollution

        What am I Reading? Measuring Indoor Air Pollution

        If you’re interested in contributing a short What Am I Reading post, we’d love to hear from you! Email us at cache@colorado.edu.

        Written by Elizabeth Sorensen Montoya, Ph.D. University of Colorado Boulder
        www.elizabethsorensenmontoya.com

        In a previous post, I explored the different methods for measuring outdoor air pollution and its impact on cognitive aging. In this post, I turn to the importance of considering other major sources of air pollution exposure—primarily indoor air pollution (IAP), which constitutes a significant and relatively understudied component of total exposure.  

        In developed nations, people spend nearly 90% of their time indoors (Klepeis et al., 2001). For adults aged 65 and older, approximately 80% of that time is spent within their own homes (Spalt et al., 2016). This high proportion of time spent indoors, coupled with estimates that IAP levels are two to five times higher than outdoor levels (Wallace et al., 1986), suggests that IAP (whether at home, school, or the workplace) is a meaningful channel of exposure. Yet until fairly recently, this channel had been severely underexplored in the academic literature due to a lack of sufficient monitoring capabilities. As technological advancements have increased the validity, reliability, and affordability of IAP monitors (Wang, Delp, and Singer, 2020), understanding the health impacts of IAP exposure has become increasingly feasible.  
         
        This issue is particularly significant in developing countries, where many households depend on solid fuels such as wood or coal for cooking and heating purposes, contributing to higher levels of IAP. Studies analyzing the impacts of such exposure have found significant associations between solid fuel use and reduced cognitive performance, as well as increased risk of cognitive decline (Peng et al., 2025). These studies also find that switching to cleaner fuel (such as electricity or natural gas) is associated with a lower risk of cognitive decline. However, few of these studies directly measure IAP, and instead rely on fuel type as a proxy for IAP. Though still indirect, Chen et al. (2023) estimate IAP exposure among older adults in Taiwan based on home ventilation status and daily indoor time, finding that even low-level IAP exposure is associated with cognitive impairment. As monitoring technology continues to improve, incorporating direct measures of IAP could build on this research and help clarify the pathways through which exposure affects cognitive performance. 

        Recent studies using real-time indoor air quality data offer further evidence of these cognitive effects. Using indoor sensors at a large chess tournament in Germany, Künn, Palacios, and Pestel (2023) find that higher levels of particulate matter (PM2.5) increase the likelihood of errors, suggesting that lower indoor air quality can harm one’s strategic decision making. 

        While observational studies like this offer valuable insight, it’s difficult to truly randomize exposure to IAP, making it difficult to draw firm causal conclusions. Xu et al. (2024) address this challenge by conducting an experiment in which college students took standardized tests on two consecutive weekends, with in-room air purifiers set to different filtration modes across the two test days. They find that air filtration is significantly associated with improved test scores—further supporting the idea that lower indoor air quality can harm cognitive function. 
         
        In another randomized experiment, Metcalfe and Roth (2025) explore the role of information and awareness. The harms of IAP are not very salient among the general population, and individual monitoring is rather uncommon. Arguing that recent technological advancements have made indoor monitors more accessible, and could thus lead to increased awareness, Metcalfe and Roth implement a field experiment in which IAP is monitored in all participating households, but IAP levels are revealed only to a randomly selected treatment group. They find that presenting households with information about their own IAP levels leads to a 17% overall reduction in pollution and a 34% reduction during periods of occupancy, suggesting that improved awareness alone can drive meaningful change.  
         
        While much of the current research on IAP has focused on the home, exposure also occurs in schools, workplaces, and during commutes. Using ambient air pollution exposure, de Souza et al. (2023) find large disparities in exposure between the home and workplace. Understanding whether similar disparities exist for IAP seems crucial, especially given that indoor air quality may vary substantially by workplace. While previous studies have used personal samplers or stationary sensors to examine workplace exposure to various hazards (e.g., particulate matter, chemicals, radiation), less is known about how IAP levels compare across the different indoor environments individuals occupy in a typical day, such as the home (particularly relevant for the retired population), workplace, and transit settings. How can such variation be accurately measured? 

        Wearable personal monitors present a potential solution to this challenge by allowing researchers to track individual-level exposure in real time as people move through different settings. Wako et al. (2025) provide a helpful review of the validity, reliability, and acceptability of these devices for exposure assessment. The reviewed studies suggest that these devices are generally reliable, but more accurate indoors than outdoors.  They also highlight important limitations, including frequent malfunctions and user concerns regarding device size, noise, and ease of use.   

        By capturing individual-level time- and location-specific data, wearable monitors offer a potential method for improving the accuracy of air pollution measurement—particularly for IAP, where their performance is the strongest. However, the use of such devices for large-scale assessments is resource-intensive and likely not feasible for every researcher. Further, device uptake and proper use may be correlated with unobserved factors like health awareness or technological savvy, and in studies analyzing cognition, may be directly related to the outcome of interest. While these devices offer a promising tool for providing more granular measures of exposure, their use must carefully account for these limitations.  
         
        All of the cited studies point to the importance of taking IAP seriously; the existing research suggests it is a meaningful contributor to overall exposure and an important factor in cognitive decline. Advances in monitoring technology are making it easier to move beyond proxies and estimated exposure and toward direct, individual-level exposure. There are certainly still real challenges, particularly when it comes to large-scale implementation, as this research often demands significant resources both in cost and personnel. But a growing range of methods—from experimental interventions to personal monitoring—are helping shed light on when and where IAP matters most.  


        References: 

        Chen, Yen-Ching, Pei-Iun Hsieh, Jia-Kun Chen, Emily Kuo, Hwa-Lung Yu, Jeng-Min Chiou, and Jen-Hau Chen. “Effect of indoor air quality on the association of long-term exposure to low-level air pollutants with cognition in older adults.” Environmental Research 233 (2023): 115483. 

        de Souza, Priyanka, Susan Anenberg, Carrie Makarewicz, Manish Shirgaokar, Fabio Duarte, Carlo Ratti, John L. Durant, Patrick L. Kinney, and Deb Niemeier. “Quantifying disparities in air pollution exposures across the United States using home and work addresses.” Environmental science & technology 58, no. 1 (2023): 280-290. 

        Klepeis, Neil E., William C. Nelson, Wayne R. Ott, John P. Robinson, Andy M. Tsang, Paul Switzer, Joseph V. Behar, Stephen C. Hern, and William H. Engelmann. “The National Human Activity Pattern Survey (NHAPS): a resource for assessing exposure to environmental pollutants.” Journal of Exposure Science & Environmental Epidemiology 11, no. 3 (2001): 231-252 

        Künn, Steffen, Juan Palacios, and Nico Pestel. “Indoor air quality and strategic decision making.” Management Science 69, no. 9 (2023): 5354-5377. 

        Metcalfe, Robert D., and Sefi Roth. Making the Invisible Visible: The Impact of Revealing Indoor Air Pollution on Behavior and Welfare. No. w33510. National Bureau of Economic Research, 2025. 

        Peng, Hongye, Miyuan Wang, Yichong Wang, Zuohu Niu, Feiya Suo, Jixiang Liu, Tianhui Zhou, and Shukun Yao. “The association between indoor air pollution from solid fuels and cognitive impairment: a systematic review and meta-analysis.” Reviews on environmental health 40, no. 1 (2025): 85-96. 

        Spalt, Elizabeth W., Cynthia L. Curl, Ryan W. Allen, Martin Cohen, Sara D. Adar, Karen H. Stukovsky, Ed Avol et al. “Time–location patterns of a diverse population of older adults: the Multi-Ethnic Study of Atherosclerosis and Air Pollution (MESA Air).” Journal of exposure science & environmental epidemiology 26, no. 4 (2016): 349-355. 

        Wako, Wako Golicha, Tom Clemens, Scott Ogletree, Andrew James Williams, and Ruth Jepson. “Validity, Reliability and Acceptability of Wearable Sensor Devices to Monitor Personal Exposure to Air Pollution and Pollen: A Systematic Review of Mobility Based Exposure Studies.” Building and Environment (2025): 112931. 

        Wallace, Lance A., Edo D. Pellizzari, Tyler D. Hartwell, Roy Whitmore, Charles Sparacino, and Harvey Zelon. “Total Exposure Assessment Methodology (TEAM) Study: personal exposures, indoor-outdoor relationships, and breath levels of volatile organic compounds in New Jersey.” Environment International 12, no. 1-4 (1986): 369-387. 

        Wang, Zhiqiang, William W. Delp, and Brett C. Singer. “Performance of low-cost indoor air quality monitors for PM2. 5 and PM10 from residential sources.” Building and Environment 171 (2020): 106654. 

        Xu, Jia, Hong Zhao, Yujuan Zhang, Wen Yang, Xinhua Wang, Chunmei Geng, Yan Li et al. “Reducing indoor particulate air pollution improves student test scores: a randomized double-blind crossover study.” Environmental Science & Technology 58, no. 19 (2024): 8207-8214. 

        Continue reading

        What Am I Reading: Pollution, Cognitive Aging, and How We Measure the Hard to Measure 

        What am I Reading? Pollution, Cognitive Aging, and How We Measure the Hard to Measure 

        If you’re interested in contributing a short What Am I Reading post, we’d love to hear from you! Email us at cache@colorado.edu.

        Written by Elizabeth Sorensen Montoya, Ph.D. University of Colorado Boulder www.elizabethsorensenmontoya.com

        The relationship between air pollution and negative health outcomes (including mortality), has been well-documented across many disciplines. A bit more recently, researchers have begun to explore how air pollution may also affect cognitive decline. In fact, the Lancet Commission (2020) has identified air pollution as a risk factor for dementia.   

        As I’ve been reading recent studies in this space, I’ve been struck not just by the findings, but also by the different approaches researchers use to measure something as invisible and transient as air pollution, and something as complex as cognition. 

        Below, I provide a quick tour of the different approaches used in the studies I’ve been reading: Shaffer et al. (2021), Shi et al. (2022), and Bishop et al. (2023). 

        How do we measure exposure? 

        Although it would make researchers’ lives easier, air pollution does not respect geographic boundaries and can vary substantially even over small spatial scales.  Given this mobile nature of air pollution, alongside the likely importance of long-term exposure, assigning accurate exposure is difficult. Choosing one measurement strategy over another, of course, comes with tradeoffs.  

        While the focus of this post will be on measures of outdoor air pollution, it is important to note the limitations of relying solely on outdoor measures.  People spend the majority of their time indoors, where pollutant levels are estimated to be two to five times higher than outdoor levels (Wallace et al., 1986) due to factors like poor ventilation and indoor sources like cooking and cleaning products. Observing only outdoor exposure—even if at the individual-level—misses an important channel of exposure, resulting in measures that may significantly underestimate true exposure. I explore the growing body of work on indoor air pollution in a future post 

        That said, much of our current understanding of the health impacts of air pollution at scale comes from the use of outdoor, fixed-site pollution monitors. These monitors provide highly accurate and frequent (in many cases, hourly) measurements, but only in certain places and often concentrated in urban and traffic-heavy areas. In low- and middle-income countries, limited monitoring infrastructure makes it difficult to assess air quality consistently, often requiring support from international partnerships. In these settings, air quality monitors are commonly placed at U.S. embassies to help fill gaps in monitoring coverage, though recently the U.S. government has discontinued the public sharing of these data. 

        While using fixed-site monitor data can improve accuracy, it can also limit the study population and introduce endogeneity. Monitors may be disproportionately located in areas where air pollution has historically been a problem, or in areas with specific demographic characteristics. These characteristics, like income, race, or education, can also influence cognitive outcomes throughout one’s life course, making it harder to separate the true effect of pollution from these other confounding factors.  

        Some studies attempt to address this by augmenting monitor data with more individualized measures of exposure. Shaffer et al. (2021), for instance, leverage the Adult Changes in Thought cohort study, a longitudinal study of adults aged 65 and older in Seattle, which placed low-cost air pollution sensors in participants’ homes. Using these individual-level measures, they find that increases in long-term exposure to PM2.5 are associated with a substantial increase in dementia diagnoses. While this approach enhances spatial resolution and better captures individual-level exposure, it is typically constrained by geography and sample selectivity, potentially reducing generalizability.  
         
        Of course, few studies will have the resources to place monitors in individual homes, but there are other ways to leverage the more publicly available fixed-site monitor data. Bishop et al. (2023) take a clever approach that trades some precision for scale and causal identification by coupling monitor data with a quasi-experimental design exploiting the U.S. Clean Air Act’s attainment and nonattainment classifications. Counties that just exceed the federal PM2.5 standard are required to implement pollution controls, while similar counties just below the threshold are not, creating a regulatory discontinuity that serves as a natural experiment.  The authors find that increases in long-term exposure increase the probability of a dementia diagnosis, with effect sizes similar to those reported in Shaffer et al. (2021). While this approach lacks individualized exposure, likely resulting in some measurement error, it offers a strong identification strategy and broad generalizability.  

        Another common strategy is to use modeled or satellite-based estimates of exposure to increase spatial coverage, even in areas lacking ground monitors.  Shi et al. (2022) use satellite-derived models to estimate long-term PM2.5 exposure across the entire United States, producing complete spatial coverage and allowing them to link pollution estimates to cognitive outcomes in large, nationally representative samples. Like the other studies, they find that increases in long term exposure increase the likelihood of a dementia diagnosis.  

        The use of these satellite data makes it possible to study massive populations—even at a global scale. However, like other strategies, this approach comes with tradeoffs: modeled data are less precise than observed pollution levels from monitors and depend on assumptions about how pollution moves through time and space. These assumptions, though grounded in environmental science, can still introduce error. Further, resolution varies by product, typically ranging from 1 to 10 kilometers. In general, there is a trade-off between spatial detail and global or temporal coverage: finer-resolution data require more satellite observations and greater computing power.  

        The tradeoffs between precision and coverage are not only limited to the sources of exposure measurement, but also to how it is defined. You may have noticed that that each of the referenced studies considers “long-term” exposure, but each defines and calculates this somewhat differently: Shaffer et al. use a 10-year moving average; Bishop et al. use a decadal cumulative measure; and Shi et al. use up to 17 years of annual averages. While these approaches are well-suited to capturing chronic exposure patterns, they may miss the impact of acute, high-concentration pollution events, which may also present health consequences. For example, extreme events like wildfires or large industrial accidents will be smoothed out in long-term averages, making it difficult to isolate their effects. While the existing body of literature points to long-term exposure as a key risk factor for cognitive decline, short-term, high-intensity events may also play an important role. 

        How do we measure cognition? 

        Just as there’s no single way to measure exposure, there are multiple ways to measure cognition. Studies differ in how they define cognitive decline, and these differences, just as with differences in exposure measurement, present their own set of tradeoffs. 

        From my own reading (which is certainly not exhaustive), it appears that there are two primary ways of measuring cognitive outcomes: administrative data—such as Medicare claims which rely on physician diagnoses recorded using ICD codes, and standardized cognitive assessments (like those conducted in the Health and Retirement Study).  

        Shi et al. (2022) and Bishop et al. (2023) both use Medicare claims data, allowing them to study large populations over time. The tradeoff, of course, is that these records may represent only the more severe stages of cognitive decline and may miss early cognitive changes that impact quality of life. These data may also leave out people with lower access to medical care, raising concerns about who is and is not observed.  

        Shaffer et al. (2021), on the other hand, rely on longitudinal cognitive assessments conducted by the Adult Changes in Thought study. While the authors use scores from these assessments to assign dementia diagnoses based on a clinical threshold, these or similar data could also be used to explore cognitive changes that occur below the diagnostic threshold, offering a more comprehensive picture of the impact of air pollution on cognition.  However, such cognitive testing is limited to smaller samples.  

        Putting it together 
         
        Across all these approaches, the trade-off so familiar to environmental and health researchers is clear: increased precision often comes at the cost of generalizability—and a literal cost, requiring funding, personnel, and typically resulting in smaller sample sizes. Conversely, approaches that maximize sample size and generalizability often sacrifice precision and nuance. But each strategy can teach us something different. It shapes what we see and who we see. Studies using fixed monitors or administrative data can cover large populations over long periods but may miss or over-represented people with certain demographic characteristics or fail to consider potential heterogeneous effects. Clinical assessments of cognition offer detailed insights into cognitive change but are limited in sample size and often the length of the period of study. Each approach reveals a different component of the relationship between air pollution and cognition, and the fuller picture emerges when we consider these components together.  

        Despite the different measurement strategies and disciplinary approaches of the cited studies, a pattern emerges: air pollution exacerbates cognitive decline. As someone trained in economics but working alongside sociologists and public health scholars, I find this convergence compelling. It also reminds me that how we measure things—what we see and what we miss—shapes the kinds of solutions we imagine. I think this insight itself calls for more interdisciplinary work on this subject—work that CACHE is here to support.  


        References:  

        Adebayo, T. and Arasu, S. (2025) ‘Scientists raise concerns as the US stops sharing air quality data from embassies worldwide’, AP News, 5 March. Available at: https://apnews.com/article/us-air-quality-monitors-8270927bbd0f166238243ac9d14bce03 

        Bishop, K.C., Ketcham, J.D. and Kuminoff, N.V., 2023. Hazed and confused: the effect of air pollution on dementia. Review of Economic Studies, 90(5), pp.2188-2214. 

        Livingston, G., Huntley, J., Sommerlad, A., Ames, D., Ballard, C., Banerjee, S., Brayne, C., Burns, A., Cohen-Mansfield, J., Cooper, C. and Costafreda, S.G., 2020. Dementia prevention, intervention, and care: 2020 report of the Lancet Commission. The Lancet, 396(10248), pp.413-446. 

        Shaffer, R.M., Blanco, M.N., Li, G., Adar, S.D., Carone, M., Szpiro, A.A., Kaufman, J.D., Larson, T.V., Larson, E.B., Crane, P.K. and Sheppard, L., 2021. Fine particulate matter and dementia incidence in the adult changes in thought study. Environmental Health Perspectives, 129(8), p.087001. 

        Shi, L., Zhu, Q., Wang, Y., Hao, H., Zhang, H., Schwartz, J., Amini, H., van Donkelaar, A., Martin, R.V., Steenland, K. and Sarnat, J.A., 2023. Incident dementia and long-term exposure to constituents of fine particle air pollution: A national cohort study in the United States. Proceedings of the National Academy of Sciences, 120(1), p.e2211282119. 

        University of Michigan. (n.d.) Health and Retirement Study: Cognition Data. Available at: https://hrs.isr.umich.edu/data-products/cognition-data 

        Wallace, L.A., Pellizzari, E.D., Hartwell, T.D., Whitmore, R., Sparacino, C. and Zelon, H., 1986. Total Exposure Assessment Methodology (TEAM) Study: personal exposures, indoor-outdoor relationships, and breath levels of volatile organic compounds in New Jersey. Environment International, 12(1-4), pp.369-387. 


        Continue reading

        What Am I Reading: Frameworks on Climate, Health, and Aging

        What am I reading? Frameworks on Climate, Health, and Aging

        Link to article

        If you’re interested in contributing a short What Am I Reading post, we’d love to hear from you! Email us at cache@colorado.edu.

        Written by Jenna Tipaldo, CUNY School of Public Health and CUNY Institute for Demographic Research, jenna.tipaldo09@sphmail.cuny.edu

        Frameworks, tools that can be used to inform research and develop interventions, can help conceptualize scientific problems and visualize complex relationships between factors that influence health. In the past several years, several new frameworks have been developed regarding the interactions between environmental factors such as climate change and health, paying special attention to the impacts on an aging population. Malecki et al. (2022) and Tipaldo, Balk & Hunter (2024) present more general frameworks regarding how environmental, social, and biological factors interact to influence the health of aging populations focusing on disease and adverse health outcomes, while Prina et al. (2024) also present a general framework based on these factors but expanding on a prior framework of healthy aging. Zuelsdorff & Limaye (2024) focus on how similar factors more specifically impact the risk and health burden of Alzheimer’s disease and related dementias (ADRD).  

        The frameworks developed in Zuelsdorff & Limaye (2024) and Tipaldo, Balk, and Hunter (2024) illustrate potential moderating and mediating factors on the pathways from climate-sensitive exposures to health outcomes, with the former honing in on ADRD and the latter considering various conditions and outcomes. Similarly, yet from a different perspective, Prina et al. (2024) consider the many factors and interactions of said factors that contribute to healthy aging, emphasizing positive outcomes for aging individuals facing climate hazards. Taking a different approach, Malecki et al. (2022) build their framework on a traditional toxicological dose-response model to show the development of disease and expand it to show factors that influence vulnerability at different stages. For example, environmental and social factors are theorized to influence hazard and exposure levels while individual-level biological and social factors influence biologically effective dose and effects.  

        Interactions and intersections between the various social and environmental factors are explicitly shown in the frameworks of both Zuelsdorff & Limaye (2024) and Tipaldo, Balk, and Hunter (2024), and are also discussed by Malecki et al. (2022). Notably, Zuelsdorff & Limaye (2024) also show policy responses such as adaptation and mitigation in the form of a feedback loop from the built environment to impact climate change, which in turn impacts factors of the built and social environments, interpersonal and individual processes, and biomedical factors. 

        While emphasizing the need to better understand mechanisms, these four recent framework papers identify myriad research gaps and directions for future research. Tipaldo, Balk, and Hunter (2024) detail recommended next steps for data collection efforts such as a need for longitudinal studies and studies that investigate cumulative impacts and factors across the life course. This suggestion is echoed by both Prina et al. (2024) and Malecki et al. (2022), which also note how big “–omics” data can be harnessed to enhance understanding. With a scope limited to the U.S., Malecki et al. (2022) call for more holistic research in various populations, and both Prina et al. (2024) and Tipaldo, Balk, and Hunter (2024) extend this by citing a need for more research in low-and-middle income and Global South settings. Together, these papers suggest a need for collaborative research across disciplines and regions to address the complex and pressing challenges faced by older adults due to climate hazards. This speaks to the goals of the 2022 NIH Climate Change and Health Initiative and Strategic Framework, which calls for the development of transdisciplinary efforts at the climate-health intersection (Woychik et al., 2022). 

        Importantly, all of these framework papers on climate/environment and aging-related health emphasize the need for research to help inform action. Prina et al. (2024) summarizes from a review of the literature potential strategies for mitigation and adaptation. Zuelsdorff & Limaye (2024) and Malecki et al. (2022) highlight a need to translate research findings into policy and actionable interventions for both practitioners and community members. Tipaldo, Balk, and Hunter (2024) note that systematic studies can help inform effective intervention strategies, building on the need for systematic studies on various climate hazards that is noted by the other framework papers. 

        References 

        • Malecki KMC, Andersen JK, Geller AM, et al. Integrating Environment and Aging Research: Opportunities for Synergy and Acceleration. Front Aging Neurosci. 2022;14:824921. doi:10.3389/fnagi.2022.824921 
        • Prina M, Khan N, Akhter Khan S, et al. Climate change and healthy ageing: An assessment of the impact of climate hazards on older people. J Glob Health. 2024;14:04101. doi:10.7189/jogh.14.04101 
        • Tipaldo JF, Balk D, Hunter LM. A framework for ageing and health vulnerabilities in a changing climate. Nat Clim Chang. 2024;14(11):1125-1135. doi:10.1038/s41558-024-02156-2 
        • Woychik RP, Bianchi DW, Gibbons GH, et al. The NIH Climate Change and Health Initiative and Strategic Framework: addressing the threat of climate change to health. The Lancet. 2022;400(10366):1831-1833. doi:10.1016/S0140-6736(22)02163-8 
        • Zuelsdorff M, Limaye VS. A Framework for Assessing the Effects of Climate Change on Dementia Risk and Burden. Gaugler JE, ed. The Gerontologist. 2024;64(3):gnad082. doi:10.1093/geront/gnad082 

        Continue reading