
What Am I Reading? Evaluating How Extreme Weather Events Can Affect Health Care Utilization

What Am I Reading? Evaluating How Extreme Weather Events Can Affect Health Care Utilization

If you’re interested in contributing a short What Am I Reading post, we’d love to hear from you! Email us at cache@colorado.edu


Written by Sara Curran and June Yang, University of Washington

Research on disasters and health has increasingly leveraged linked administrative claims data and detailed spatial information on natural disaster events in order to move beyond single-case descriptions toward quasi-experimental designs. Such linkages aim to improve knowledge about the proximate mechanism (such as health care utilization) that link the consequence of disasters to health outcomes.  Such insights about the mechanisms can then help target improvements for resilience and adaptation in the future. For example, a recent study of Puerto Rico integrated private insurance claims and beneficiary counts from multiple insurers to construct harmonized region–year indicators of infectious disease, injury, and mental health service use, and then interpreted abrupt shifts in these indicators around hurricanes, earthquakes, and the COVID-19 pandemic as signatures of disaster-related disruption to health care access and need (Stimpson et al., 2025).  Building on the same logic of combining high-resolution utilization data with externally defined measures of hazard exposure and loss, another study links national Medicare fee-for-service claims with standardized disaster databases to estimate the short-term effects of extreme weather events on morbidity and mortality across U.S. counties (Salas et al., 2024).  We summarize each article here and then offer a few suggestions for future research.

Stimpson et al. (2025) innovatively developed a harmonized repeated, cross-sectional insurance claims dataset from 2016-2022 in Puerto Rico. The aggregated data included information from each region and year about injuries, infectious diseases, mental health, and substance use claims and was standardized by the number of beneficiaries per region and year.  The annual trend lines for each type of claims category are descriptively evaluated for each region.  Following Hurricane Maria, they find in the affected regions larger or higher increases in claims related to infectious disease, injury, mental health, and substance use.  Regions that were less impacted by Hurricane Maria showed lower rates of claims across all types.  The authors argue that the data point to the need for targeted interventions to enhance overall infrastructure, especially health care infrastructure for improved health outcomes.  The Stimson et al. study is a good example of creatively generating valuable evidence from insurance claims data to descriptively observe trends and patterns. The limitations of the study’s results are in the relatively small number of cases (region-year), making it impossible to statistically evaluate whether the differences are significant.   

With a similar motivation for attention to study design, a recent article by Renee Salas and colleagues published in Nature Medicine creatively links NOAA and SHELDUS (Spatial Hazards and Economic Loss Data in the US) to Medicare fee-for-services administrative data to evaluate the impact of extreme weather events on health outcomes. The study examines counties impacted by at least one of 42 NOAA-identified, extremely damaging events (damages a total value of US$ 1 billion or higher), occurring between 2011 and 2016, and seeks to understand whether health outcomes changed in unaffected and affected counties before and after the event.  They use the SHELDUS data to identify county-level damages for affected counties (the property and crop damages for those affected counties ranges between $3,220-$12.51 billion per county).  Combined with the CMS data at the county-level they systematically compare affected and non-affected counties.  This valuable quasi-experimental design offers a careful comparison across time evaluating impacts the week following a disaster, 1-2 weeks after, and 3-6 weeks after. These spatial and temporal comparisons across the entire country, offer an important national assessment of the immediate and lagged health outcome effects of severe weather events.  Notably, the study limits itself to floods, severe storms, and winter storms, which, they argue, are events that are relatively short-lived, destroy infrastructure, and can have lingering social and built environment effects.  They contrast these events to wildfire and droughts which often last for hundreds of days and have somewhat different impacts on infrastructure, so the authors do not evaluate these types of events and also exclude counties experiencing them from eligibility in the selection of matched control counties. They make two sets of comparisons.  First, they compare the relative change in health outcomes in affected counties before and after events.  Second, they compare similar counties with and without exposure to the event using a difference-in-difference estimation.  They find similar results with both types of comparisons.

Fig. 2: Forest plots of ED visit and mortality relative change and DID for affected counties in post-disaster weeks 1–2 and weeks 3–6 in Medicare beneficiaries exposed to a short-term NOAA NCEI billion-dollar weather disaster in the United States. (Salas et al., 2024)

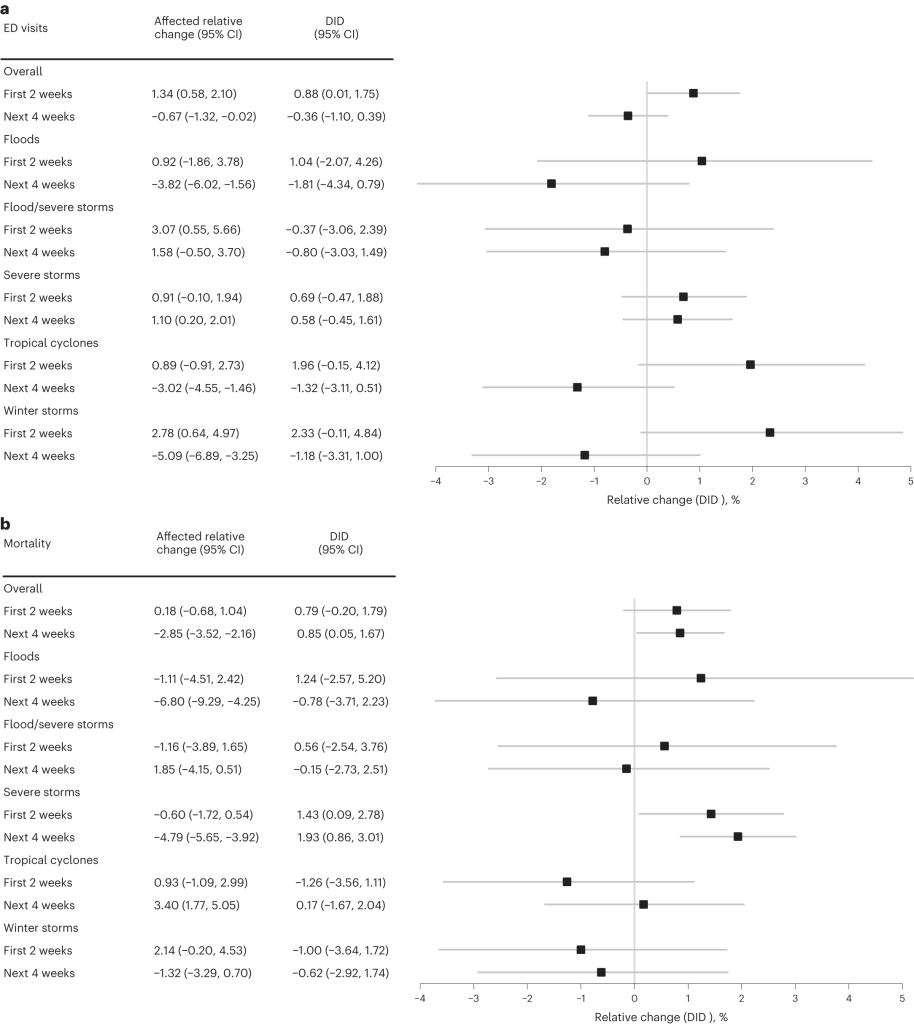
Winter storms and tropical cyclones are most damaging to health outcomes 

Their most important findings are summarized in their Figure 2.  They show how emergency department visits and mortality are significantly increased by severe events.  In Panel a. emergency department visits are significantly higher in the first two weeks following a severe event, but not so in the weeks 4 or more.  Most of these differences are driven by severe winter storms and tropical cyclones. In Panel b. mortality is significantly higher across all time lags.  This mortality effect is primarily driven by severe storm events.  Not shown in Figure 2, but discussed elsewhere, is the finding that non-elective hospitalizations remained unchanged over all types of severe storms and all the time lags.  Besides demonstrating how particular types of severe events cause significant increases in emergency department visits and mortality, they also show that among storms totaling more than 1 US $ Billion in damages overall, the most expensive storm events are the ones driving the results (those in the upper quartile of counties (damages ranging between $622.66K-12.51B)).

This analyses and the linked data, together with Stimpson et al. (2025) study, suggest many useful avenues for further research that could leverage routinely collected administrative and claims data to understand the more precise and proximate mechanisms of health care utilization and costs of disasters on the US economy and health, and well-being of the US population. Future work can build on these designs to probe the mechanisms that generate vulnerability, such as pre-existing comorbidities, healthcare access barriers, and disruptions to utilities or transportation, and to identify which communities are more, or less resilient in the face of weather shocks.

Both studies reviewed here highlight the importance of understanding crucial heterogeneity of geography and preparedness impacting health care needs and capacities: for example, winter storms may be especially deadly in places like Texas where infrastructure and housing are optimized for heat rather than cold. Such geographic variation almost certainly intersects with social disadvantage, race, income, and other axes of inequality, suggesting that analyses that explicitly consider these overlapping vulnerabilities in relation to hazard exposure, built environment, and structural conditions are a critical next step. By expanding this line of inquiry to additional disaster types and contexts, researchers can generate evidence that not only clarifies patterns of risk, but also informs theory and policy on the social determinants of disaster vulnerability, resilience, and health system performance.

For those interested, code for Salas et al. (2024) is available at GitHub and can be found at https://github.com/Billion-Dollar-Weather-Medicare/ED-Hospitalizations-Mortality/.

Notes about administrative data:

“Administrative data” here means records generated during the routine administration of healthcare and insurance, for example, billing/claims files, enrollment and beneficiary summary files, and facility or provider administrative records. These datasets are not collected for research, but capture large populations and longitudinal events (visits, diagnoses, procedures, dates and place of care), which makes them powerful for measuring changes in utilization, costs, and short-term outcomes after disasters, while also carrying limitations (limited clinical detail, timing/coverage constraints, and privacy/regulatory restrictions).

Salas et al. (2024) used fee-for-service Medicare administrative claims and beneficiary files to measure ED visits, hospitalizations, and mortality after billion-dollar weather disasters (these Medicare files are controlled by Center for Medicare & Medicaid Services and cannot be redistributed by the authors).  Stimpson et al. (2025) analyzed private insurance claims for Puerto Rico obtained through the territory’s Office of the Commissioner of Insurance, illustrating how regulator-level aggregates from insurers can be used to study regional patterns after consecutive disasters.

References 

  • Salas, Renee, Laura Burke, Jessica Phelan, Gregory Wellenius, E. John Orav, & Ashish Jha. 2024. “Impact of Extreme Weather Events on Healthcare Utilization and Mortality in the U.S.” Nature Medicine  https://doi.org/10.1038/s41591-024-02833-x

    • Stimpson, Jim P., Damaris Lopez Mercado, Alexandra C. Rivera-González, Jonathan Purtle, and Alexander N. Ortega. 2025. “A Regional Analysis of Healthcare Utilization Trends during Consecutive Disasters in Puerto Rico Using Private Claims Data.” Scientific Reports 15(1):5249. doi:10.1038/s41598-025-89983-1.

        Continue reading

        Triply robust approach to evaluate the health impacts of extreme weather events

        Triply robust approach to evaluate the health impacts of extreme weather events

        Link to code

        Click here

        Date: October 2025


        Authors/Creators/ Team Members:  Lingzhi Chu, Kai Chen

        Specific purpose of code: This code is designed to evaluate the relationships between extreme weather events and health outcomes.

        General Application: The code was first designed to evaluate the mortality risk associated with flood in the contiguous United States (https://doi.org/10.1038/s41467-025-58236-0). The code could be used with other “pulse” events (e.g., extreme weather events) or other health outcomes (e.g., hospital visits).

        How does or could this code allow researchers to assess research questions related  to aging or life course?: This code could be used for any specific age group or subsets by age.

        Data sets used: 

        • Population, socioeconomic, or health data: Mortality data from CDC National Center for Health Statistics.
        • Climate, weather, disaster or environment data: NOAA Storm Events Database.

        Are all the data publicly available or are some restricted-access? NOAA Storm Events Database is publicly available. The monthly county-level cause specific mortality data are protected and are not publicly available due to data privacy laws but can be requested from the National Center for Health Statistics (https:// www.cdc.gov/nchs/index.htm).

        Links to data: https://github.com/CHENlab-Yale/Flood_mortality_US

        Coding Language:  R 

        Tools and Packages used:  N/A

        Output(s): https:// doi.org/10.1038/s41467-025-58236-0

        Spatial extent: No restriction

        Temporal extent: No restriction

        Published papers that use this code:

        Chu, Lingzhi, Joshua L. Warren, Erica S. Spatz, Sarah Lowe, Yuan Lu, Xiaomei Ma, Joseph S. Ross, Harlan M. Krumholz, and Kai Chen. “Floods and cause-specific mortality in the United States applying a triply robust approach.” Nature Communications 16, no. 1 (2025): 2853.

        DOI: https://doi.org/10.1038/s41467-025-58236-0

        Continue reading

        Effects of Outdoor Wildfire PM2.5 on Alzheimer’s Disease and Related Dementia

        Effects of Outdoor Wildfire PM2.5 on Alzheimer’s Disease and Related Dementia

        Investigators:

        Jennifer Stowell, Chad Milando, and Greg Wellenius

        Funding:

        NIA R61AG086854 (CACHE)

        Data sources:

        Measures:

        • Health Measures: AD/ADRD ED visits and hospitalizations will be identified using the International Classification of Diseases versions 9 and 10.
        • Aging Measures: Age of event is recorded for all patients, and the analysis is restricted to persons aged at least 40 years.
        • Climate Measures: Daily WFS-specific PM2.5, heat, and relative humidity will allow us to examine un-biased associations between wildfire smoke and AD/ADRD. Meteorology will include multiple measures of temperature (i.e. absolute, heat index, wet bulb globe, etc.).

        Project Summary:

        We will examine the impact of exposure to WFS-specific PM2.5 on emergency department visits and hospitalizations for incident AD/ADRD or exacerbations of AD/. We will link population-weighted exposure, meteorology, and demographic variables to AD/ADRD events across the contiguous US for 2006-2023 using a large medical claims dataset. We will accomplish this using distributed lag nonlinear models (DLNM) and conditional Poisson regression. We will explore multiple lag lengths to account for delays in exposure effects. These analyses will be conducted using a case-control study design where each case is matched to non-case days within the same month, year, and on the same day of the week. This design inherently controls for all time invariant confounders, and all models will include terms for confounding variables such as temperature, relative humidity, and holidays. We will repeat our analyses stratifying on measures of individual and community-level social determinants of health (SDOH) using age, sex, and select ACS variables.

        This research will help to increase our understanding of the environmental factors associated with AD/ADRD. Our results will provide actionable evidence for public health practitioners, clinicians, and policymakers in future efforts to mitigate the impacts of climate change on AD/ADRD. Our future research will build on these results and inform an R01 proposal to examine the potential synergistic impacts of multiple extreme weather events (i.e. wildfire, drought, heat, etc.) and mixtures of pollutants on AD/ADRD in US adults.

        Outputs:

        • Poster presentations
        • Grant proposal
        • Code
        • Future publications

        Continue reading

        Daily Temperature Data Processing and Analysis: An Example for New York City

        Daily Temperature Data Processing and Analysis: An Example for New York City

        Link to code

        Click here

        Date: September 2025


        Authors/Creators/ Team Members: 

        Author: Selen Ozdogan

        Team Members: Frank Heiland, Deborah Balk, Jennifer Brite, Peter Marcotullio

        Specific purpose of code:

        This code aims to provide a comprehensive guide to acquiring and cleaning daily temperature and precipitation data for New York City between 2015-2022 using two primary data sources: Global Historical Climatology Network daily (GHCNd) from the U.S. National Centers for Environmental Information and ERA5-Land Reanalysis from the European Union’s Copernicus Project.

        From these data sources, the code assembles daily air temperature and precipitation. It also calculates wet bulb temperature and creates temperature exposure variables with varying temporal resolutions. The extent of this example is New York City (NYC). Aggregation of the input data is necessary to generate estimates for all NYC.  

        The code is embedded in an R Markdown pdf file.

        General Application:

        This is a guide to obtaining climate data and creating different temperature measures and temporal exposure lags. With minor tweaks, the code could be used for other locations/time-periods and can be merged with any daily data set for data analysis. Note that our example here is from 2015-2022, but that time period can be extended (as we also did in the underlying research); a short time period is given in this R Markdown package to facilitate the demonstration.

        How does or could this code allow researchers to assess research questions related  to aging or life course?:

        The output from this code, daily climate data, could be merged with any daily (or more aggregated temporal frequency) data to study the impact of extreme weather events on aging populations, so long as the underlying spatial resolution of the climate data and population data (from either administrative, census or survey data) are spatially and temporally compatible.

        Data sets used: 

        • Climate, weather, disaster or environment data:

          Global Historical Climatology Network daily (GHCNd) – point location format.

          ERA5-Land Reanalysis data – grid format

        • All data are publicly available

        Links to data:

        1. Global Historical Climatology Network daily (GHCNd)
        2. Climate Data Store

        Coding Language:  R, Python

        Tools and Packages used:

        R: tidyverse, lubridate, magrittr, here, sf, raster, exactextractr, openxlsx, fixest, slider

        Python: os, cdsapi, time, Path

        Output(s): Dataset

        Spatial extent: New York City (roughly 300 sq. miles or 778 sq. km.)

        Temporal extent: 2015-2022

        Comments: Replication package for the Demography article will be available here. 

        Published papers that use this code:

        Forthcoming paper “Extreme Weather and Mortality of Vulnerable Urban Populations:  An Examination of Temperature and Unclaimed Deaths in New York City”, in Demography (2026).

        Link to PAA Poster

        Related Content: 

        Demonstration Project: Impact of Extreme Weather on Hard-to-Capture, Vulnerable Populations: Evidence from Hart Island — New York’s Public Burial Ground

        Seminar: Measuring Extreme Temperatures and Thermal Comfort in Aging and Demographic Reseach 

        Continue reading

        Severe Heat Days using the Universal Thermal Comfort Index

        Severe Heat Days using the Universal Thermal Comfort Index

        Link to code

        Click here

        Date: September 2025


        Authors/Creators/ Team Members: Marcial Yangali (marcialy@colmex.mx)

        Reviewers: Landy Sánchez and Emerson Baptista

        Specific purpose of code: It demonstrates how to construct severe heat measures using the UTCI data (ERA5-HEAT ). It starts by showing data manipulation from raster (grid data) to a tabular dataset that obtains UTCI values for each municipality in Mexico. Then, it presents how to map and analyze such data. Finally, it shows how to count the number of days of severe heat (32°C UTCI and above). This script is part of the demonstration CACHE project “Heat, Disability in older adults and Care” from El Colegio de Mexico.

        General Application: This develops familiarity with heat data and fundamental skills to construct an environmental dataset that can be easily integrate with demographic information.

        How does or could this code allow researchers to assess research questions related  to aging or life course?: This code help to analyze exposure to severe heat days by age structure at a subnational level. Particularly, to understand how aging realtes to higher exposure to extreme weather. Historical UTCI measures could be employ to assess cumulative heat impacts across the life course.

        Data sets used: 

        • Two publicy available datasets are used:

          • Universal Thermal Climate Index (UTCI). Copernicous ERA5-HEAT
          • 2020 Mexican Municipalities and States boundaries. INEGI (Census Bureau office)

        Coding Language:  R 

        Tools and Packages used: R packages for data manipulation (mainly dplyr but also janitor, stringr, tidyr and forcats), visualization (ggplot2, patchwork), and geospatial operations (sf).

        Output(s): Analysis results, maps and graphs

        Spatial extent:Mexico (33.0°N (North), -118.5°E (East), 14.0°N (South), and -86.0°E (West)

        Temporal extent: May 2019

        Key words: heat, severe weather, thermal index, Mexico

        Continue reading

        What am I Reading? Disentangling the Impacts of Extreme Heat on Biological Aging: Measuring the Hidden Toll on Our Body

        What am I reading? Disentangling the Impacts of Extreme Heat on Biological Aging: Measuring the Hidden Toll on Our Body

        Link to article

        If you’re interested in contributing a short What Am I Reading post, we’d love to hear from you! Email us at cache@colorado.edu.

        Written by Eun Young Choi, Postdoctoral Associate, University of Southern California

        High temperatures are heating not only our neighborhoods and homes, but also our very biology, as we suggested in a recent study (Choi & Ailshire, 2025). Among the many ways extreme heat threatens public health, its subtle yet significant impact on the body’s aging processes has begun to draw attention. I’ve been exploring how we can quantify the biological consequences of extreme heat, and why these hidden impacts matter for aging research.

        Why Focus on Biological Aging?

        Much of the climate-health literature has understandably focused on observable health outcomes: hospitalizations, respiratory and cardiovascular diseases, and death (Bunker et al., 2016; Hajat et al., 2010). These are essential indicators, but the effects of extreme heat might not immediately manifest as diagnosable conditions; instead, they may exert a silent toll at the cellular and molecular level. Over time, this biological strain can accumulate, increasing the risk of disability and disease. Biological age, measured using biomarkers that reflect physiological wear and tear, offers a promising way to identify early signs of changes in the body before chronic conditions are formally diagnosed. These include measures based on clinical biomarkers, cellular markers, and, more recently, molecular signatures such as DNA methylation (Chen et al., 2023 for review). Each of these tools provides a useful lens into how the aging process may advance more rapidly than expected based on chronological age, and how it may be shaped by external stressors like heat. Recent studies show that accelerated biological aging is associated with elevated risk of cardiovascular disease, cognitive decline, and mortality (Emami et al., 2022; Fransquet et al., 2019; Zhou et al., 2022). As such, these clocks provide a useful intermediate endpoint that can be particularly valuable when studying environmental exposures, which often unfold gradually and exert diffuse effects across multiple body systems. In this context, biological age can help us understand not just whether heat is harmful, but how it does its damage.

        How Do We Measure Heat?

        Measuring exposure to extreme heat may appear straightforward, but it involves multiple layers of complexity. The most common metric is ambient temperature (technically, the temperature in the surrounding environment), but even this can be defined in various ways—daily maximums, minimums, or averages—and it usually refers to outdoor air temperature. Others use composite indices that better approximate heat stress on the human body. The Heat Index, for example, incorporates humidity and is used to estimate heat-related stress in shaded environments (National Weather Service). The Wet-Bulb Globe Temperature (WBGT) goes further by accounting for wind speed, cloud cover, and sun angle as well to reflect conditions in direct sunlight, making it especially relevant for outdoor or occupational settings. Each of these measures captures different aspects of thermal stress, and the choice of metric should align with the study’s research question and target population. In our study, we used the Heat Index because our sample consisted of older adults, who are generally less likely to work outdoors or spend extended time in full sun. While these metrics can technically be measured indoors, they are typically based on outdoor weather data and do not directly reflect indoor conditions.

        How Can We Conceptualize Outdoor Heat Exposure to Better Estimate Health Impacts?

        Researchers have considered a variety of factors to understand the magnitude of heat-related health effects. Here, I created a conceptual cube with three axes to synthesize commonly used dimensions: exposure timing, heat intensity, and exposure context. This framework is not a modeling tool, but rather a way to clarify how different features of outdoor heat exposure interact to shape physiological burden.

        • Y-axis: What timeframe is captured?

        Exposure can occur over various timeframes: a single hot day, a multi-day heatwave, or repeated seasonal exposures over years. Short-term heat events can trigger immediate physiological stress responses (e.g., inflammation), while longer-term exposure to elevated temperatures may produce cumulative biological wear and tear. Studies use various time windows to model these effects, from several day lags to multi-year averages, depending on the health outcome of interest. While short-term physiological responses to heat stress may be transient, some effects may accumulate over time and this continuous exposure may leave biological imprints detectable by biomarker-based measures. For example, our findings show consistent associations between longer-term heat exposure (e.g., 1-year and 6-year cumulative heat days) and accelerated epigenetic aging, consistent with prior studies reporting robust associations and large effect sizes for longer-term heat exposure (Chiu et al., 2024; Ni et al., 2023).

        • Z-axis. How severe is the exposure?

        This axis represents the intensity of the heat experienced. Researchers use both relative and absolute metrics to define extreme heat. Relative measures, such as temperatures above the 95th percentile of the local historical distribution, are useful for identifying deviations from the norm, especially considering that long-term sublethal heat can lead to physiological adaptations and increased thermal tolerance (Carr et al., 2024; Périard et al., 2016). In contrast, absolute thresholds (e.g., >95°F or >35°C) provide a fixed reference point that can be useful for identifying biologically hazardous temperatures and facilitating comparisons across regions. For the Heat Index, for example, the National Weather Service offers a practical classification: 80°F (Caution), 90°F (Extreme Caution), and 103°F (Danger). The choice between relative and absolute measures should be guided by the study’s objective, the population’s vulnerability, and the geographic and climatic context.

        • X-axis. How is exposure experienced?

        This axis reflects the context: the individual or situational factors that influence how ambient heat translates into actual personal exposure. Most studies use outdoor temperature data from weather stations or modeled products, and these measures may not fully capture personal exposure – a challenge also seen in air pollution research, where ambient data often serve as proxies for individual exposure (see related discussion). It is therefore important to interpret such data as approximating the potential for exposure rather than direct experience. Key contextual modifiers include time spent outdoors, occupational exposure, housing quality, and access to cooling resources. For instance, older adults living in poorly insulated homes without air conditioning may experience disproportionately high indoor heat, despite similar ambient temperatures. Recent work has also highlighted substantial within-neighborhood variation in heat exposure, reinforcing the need to consider behavioral and environmental mediators when interpreting ambient heat metrics (Li et al., 2023; Reid et al., 2009).

        The color gradient in the figure reflects increasing physiological burden, illustrating how these dimensions can intersect to magnify biological stress. For instance, someone who works outdoors (high context), over many years (longer timing), and in areas where temperatures regularly exceed 100°F (high intensity), may experience substantially greater heat-related aging than someone briefly exposed to moderate heat while indoors.

        What We Found about Heat and Epigenetic Aging

        There is growing evidence from animal studies that heat stress can trigger epigenetic alterations such as DNA methylation, positioning these molecular changes as a plausible biological mechanism linking environmental exposures to long-term health outcomes (Murray et al., 2022). Epigenetic clocks—biological age estimates derived from DNA methylation levels across the genome—can capture cumulative physiological responses to stress and toxins. In our work, we’ve begun to apply these epigenetic measures to understand how outdoor heat exposure may accelerate epigenetic aging. Our findings show that outdoor heat, especially long-term, was significantly associated with greater acceleration in epigenetic age in a diverse national cohort of older adults. These associations persisted even after adjusting for individual-level socioeconomic and behavioral factors, as well as community-level characteristics. Taken together, these findings suggest that chronic heat exposure may not only increase immediate health risks but also disrupt key systems contributing to a steeper trajectory of epigenetic aging, potentially through pathways involving oxidative stress, inflammation, and metabolic reprogramming (Murray et al., 2022). Nonetheless, further evidence is needed to clarify the specific mechanisms linking heat exposure to epigenetic aging acceleration.

        Moving Forward

        Advancing this research requires embracing the complexity of both exposures and outcomes. On the exposure side, we must better account for co-occurring environmental stressors. Heat rarely acts alone. For instance, air pollution tends to worsen on hot days, creating compound exposures that may have synergistic effects on biological systems. We also need more attention to contextual variation, how housing, neighborhood infrastructure, and access to cooling resources shape actual heat burden experienced by older adults. This is especially pressing in low-income or racially marginalized communities, where systemic disinvestment may amplify risk. On the outcome side, biological aging is multidimensional. While epigenetic clocks help pinpoint biological responses to heat across systems, they capture only part of the picture. It remains unclear how—and to what extent—heat stress affects specific systems such as the immune, neuro, metabolic, cardiovascular, and renal systems in large human samples. Integrating additional biomarkers such as inflammatory cytokines, neurodegenerative markers, and metabolomic signatures can help build a more comprehensive understanding of how heat “ages” us biologically.

        Final Reflections

        Extreme heat is no longer exceptional—it is a defining feature of our climate reality. To understand its full toll on aging populations, we must look beyond acute events and capture the long-term, cumulative effects of chronic stress. Biological aging measures offer an important window into these processes, enabling earlier detection, monitoring of intervention impacts, and deeper insight into vulnerability. But how we measure exposure and aging matters. Choices about metrics and methods shape our conclusions—and our ability to act. Integrating high-resolution environmental data with multidimensional biomarkers will be key to building a fuller picture of how climate shapes the aging process.

        References

        Choi EY, Ailshire JA. Ambient outdoor heat and accelerated epigenetic aging among older adults in the US. Sci Adv. 2025;11(9):eadr0616. doi:10.1126/sciadv.adr0616

        Bunker A, Wildenhain J, Vandenbergh A, et al. Effects of Air Temperature on Climate-Sensitive Mortality and Morbidity Outcomes in the Elderly; a Systematic Review and Meta-analysis of Epidemiological Evidence. eBioMedicine. 2016;6:258-268. doi:10.1016/j.ebiom.2016.02.034

        Hajat S, O’Connor M, Kosatsky T. Health effects of hot weather: from awareness of risk factors to effective health protection. The Lancet. 2010;375(9717):856-863. doi:10.1016/S0140-6736(09)61711-6

        Chen R, Wang Y, Zhang S, et al. Biomarkers of ageing: Current state-of-art, challenges, and opportunities. MedComm – Future Medicine. 2023;2(2):e50. doi:10.1002/mef2.50

        Emami M, Agbaedeng TA, Thomas G, et al. Accelerated Biological Aging Secondary to Cardiometabolic Risk Factors Is a Predictor of Cardiovascular Mortality: A Systematic Review and Meta-analysis. Canadian Journal of Cardiology. 2022;38(3):365-375. doi:10.1016/j.cjca.2021.10.012

        Fransquet PD, Wrigglesworth J, Woods RL, Ernst ME, Ryan J. The epigenetic clock as a predictor of disease and mortality risk: a systematic review and meta-analysis. Clin Epigenet. 2019;11(1):1-17. doi:10.1186/s13148-019-0656-7

        Zhou A, Wu Z, Zaw Phyo AZ, Torres D, Vishwanath S, Ryan J. Epigenetic aging as a biomarker of dementia and related outcomes: a systematic review. Epigenomics. 2022;14(18):1125-1138. doi:10.2217/epi-2022-0209

        National Weather Service, Wet Bulb Globe Temperature vs Heat Index. https://www.weather.gov/ict/WBGT.

        Chiu KC, Hsieh MS, Huang YT, Liu CY. Exposure to ambient temperature and heat index in relation to DNA methylation age: A population-based study in Taiwan. Environment International. 2024;186:108581. doi:10.1016/j.envint.2024.108581

        Ni W, Nikolaou N, Ward-Caviness CK, et al. Associations between medium- and long-term exposure to air temperature and epigenetic age acceleration. Environment International. 2023;178:108109. doi:10.1016/j.envint.2023.108109

        Deborah Carr, Giacomo Falchetta, Ian Sue Wing, Population Aging and Heat Exposure in the 21st Century: Which U.S. Regions Are at Greatest Risk and Why?, The Gerontologist, Volume 64, Issue 3, March 2024, gnad050, https://doi.org/10.1093/geront/gnad050

        Périard JD, Travers GJS, Racinais S, Sawka MN. Cardiovascular adaptations supporting human exercise-heat acclimation. Autonomic Neuroscience. 2016;196:52-62. doi:10.1016/j.autneu.2016.02.002

        Li A, Toll M, Bentley R. Mapping social vulnerability indicators to understand the health impacts of climate change: a scoping review. The Lancet Planetary Health. 2023;7(11):e925-e937. doi:10.1016/s2542-5196(23)00216-4

        Reid CE, O’Neill MS, Gronlund CJ, et al. Mapping Community Determinants of Heat Vulnerability. Environ Health Perspect. 2009;117(11):1730-1736. doi:10.1289/ehp.0900683

        Murray KO, Clanton TL, Horowitz M. Epigenetic responses to heat: From adaptation to maladaptation. Experimental Physiology. 2022;107(10):1144-1158. doi:10.1113/EP090143

        Continue reading

        How Do Extreme Environmental Events Impact Cognitive Health Among Older Adults?

        How do Extreme Environmental Events Impact Cognitive Health among Older Adults?

        Investigators:

        Drs. Jessica Finlay, Yue Sun, and Michael Esposito

        Funding:

        NIH/NIA R00AG075152, NIH/NIA P30AG066613, and NIH/NICHD P2CHD066613

        Data sources:

        Spatial coverage:

        The United States

        Temporal coverage:

        2000-2022

        Measures:

        • Health Measures: Cognitive function, physical activity, sleep, sitting time, smoking, drinking, weight loss/gain, appetite loss/increase, depression, anxiety, social isolation, loneliness
        • Individual and area-level sociodemographic measures:
          • Age, gender, race, ethnicity, education, income, and rural-urban residency
          • Population density, population living below the poverty line, proportion of non-Hispanic Black residents, proportion of owner-occupied housing units
        • Climate Measures: Extreme environmental events (e.g., floods, hurricanes, wildfires)
        • Neighborhood Environment Measures: Parks, recreation centers, eateries, grocery stores and markets, stores, civic and social organizations, religious organizations, arts and cultural sites, libraries, and educational sites

        Project Summary:

        In an era of ever-increasing climate hazards, it is critical to understand how extreme environmental events such as wildfires, floods, and hurricanes may increase risk for Alzheimer’s Disease and Related Dementias (ADRD). This project examines how extreme environmental events are associated with cognitive health among older Americans. Beyond direct biological risks such as pollution exposures, extreme events also disrupt daily routines and community networks to pose dementia risks through social and behavioral pathways. Moreover, the effects of extreme events on cognitive health and related health behaviors may vary person and place-based characteristics such as income, race/ethnicity, rurality, and social infrastructure sites (e.g., libraries, community centers, civic/social organizations) that provide support, connection, and informal care.

        We will investigate cognitive trajectories following exposure to an extreme event, as well as relevant behaviors that support brain health such as exercise, diet, smoking, and stress.

                          This project will use the nationally representative Health and Retirement Study (HRS) combined with built and natural environmental data to address these research questions. Specifically, it links HRS participants to extreme environmental events from the FEMA National Risk Index and the Spatial Hazards Events and Losses Database, as well as built environmental data from the National Neighborhood Data Archive. Findings will advance understanding of how extreme events may impact cognitive health in later life, as well as person-place variations in these associations. This project will inform community interventions and targeted programs to support individual and community recovery and long-term health following an extreme environmental event.

        Comments:

        The HRS contains detailed longitudinal measures of cognitive health. It is therefore a robust data source to examine trajectories of cognitive health over time. A restricted HRS data agreement is required to access the geographic information of respondents at the state, county, and Census tract level.

        Table 1. Core Variables from the Health and Retirement Study

        On the creation of the weather variables:

        FEMA National Risk Index data are provided at the census tract level. This index covers 18 specific hazard types: avalanche, coastal flooding, cold wave, drought, earthquake, hail, heat wave, hurricane, ice storm, landslide, lightning, riverine flooding, strong wind, tornado, tsunami, volcanic activity, wildfire, and winter weather. The database has both overall risk index for all hazard types and risk indices for individual hazards. We will use numerical scores of overall index and individual indices directly.

        Spatial Hazards Events and Losses Database data are at the county level. It covers the same hazards as FEMA National Risk Index. We will use some measures, including count of people killed, count of people injured, and damage to property in adjusted U.S. dollars.

        Outputs:

        Peer-reviewed publications, conference presentations, grant proposals

        Continue reading

        Impact of Extreme Weather on Hard-to-Capture, Vulnerable Populations: Evidence from Hart Island — New York’s Public Burial Ground

        Impact of Extreme Weather on Hard-to-Capture, Vulnerable Populations: Evidence from Hart Island — New York’s Public Burial Ground

        Investigators:

        Frank W. Heiland, Deborah Balk, Selen Ozdogan, Jennifer Brite, Peter Marcotullio and Christian Braneon

        Funding:

        NIAID R03 Grant AI166809-01, NIA R61AG086854 (CACHE)

        Data sources:

        • Daily Unclaimed Death Records: The burial records from Hart Island, New York City’s public cemetery located on an island near the Bronx in the Long Island Sound, are publicly available through a searchable online database named Hart Island Lookup Service (New York City Department of Correction, 2024). We scrape the data between 1977 and 2022 for the present study. The Hart Island records include exact date of death (day-month-year) and, for most records, first and last names, age at death, sex (male/female/unknown), and place of death (homes, residential care facilities, hospitals or on the street). A small number of records are available before 1977, but the counts suggest the data are not complete and were therefore excluded. On Hart Island, graves are numbered and organized in sections within plots. For bodies buried on Hart Island in more recent years the records typically also include a medical examiner case number, which reveals information about the location at death (Heiland et al., 2023; New York City Department of Correction, 2024). There have been very few child burials on Hart Island since 1977, but there are many records of infants and fetuses. The present analysis looks at adults and children only.
        • Air temperature: The National Oceanic and Atmospheric Administration (NOAA) collects daily weather-station meteorological data in the Global Historical Climatology Network (GHCN) (Menne, Durre, Korzeniewski, et al., 2012). The records for New York City are reliable historically and the data are provided in year-month-day format. We use daily maximum and minimum dry bulb (air) temperature measured at three stations (or point locations) in NYC (LaGuardia airport in northern Queens county, Central Park in Manhattan (New York county), and JFK airport in southern Queens county) in degrees Celsius. We average the temperature extremes over these three locations to obtain the city-wide maximum and minimum for each day and then convert to Fahrenheit for ease of interpretation.
        • Wet bulb temperature: We use the ERA5-Land hourly data (Muñoz-Sabater et al., 2021) to calculate the wet bulb temperature, which measures how warm it feels based on evaporative cooling (i.e. taking air humidity into account). These satellite-based, reanalysis raster-format data indicate hourly temperature and dewpoint in Celsius at a spatial resolution of 0.25 by 0.25 latitude-longitude degrees. Using the underlying variables, we obtain the hourly wet bulb temperature for each grid between 1977 to 2022 and then convert to Fahrenheit. We then temporally aggregate it by calculating the daily maximum and minimum wet bulb temperatures. Then, we spatially aggregate the raster data by retrieving the maximum wet bulb temperature within the boundaries of New York City, obtained from the Borough Boundaries vector data (NYC OpenData, 2024). We call this measure of the maximum value of the daily maximum temperature the “max-max” wet bulb temperature. We obtain the “min-min” in a similar manner.

        Measures:

        • Mortality Measures: Unclaimed death count in New York City since 1977 (daily number of deaths where the body remained unclaimed and was subsequently buried on Hart Island — the City’s public burial ground). Recent research shows the importance of understanding unclaimed and public burial deaths (Brite et al. 2024, Sohn et al. 2020), and to the extent that daily death records are reported, these data are structurally similar to other types of administrative data that indicate daily demographic events.
        • Aging/older adults Measures: Age at death information is available for most adult decedents (the analysis is restricted to persons over age 1 though very few persons under 18 are buried on Hart Island). We create a dichotomous death count measure for population under 65, and 65 and above.
        • Climate Measures: Daily data allow for the construction of measures of temperature and total precipitation so that we can examine the associations between climate and mortality over 50 years among the especially vulnerable. NOAA data allow for measures of air temperature and the ERA5 reanalysis data allow for the construction of a wet bulb measure. We use temperature maximum and minimum rather than average temperatures in the main analysis, in order to isolate the effects of changes in minimum and maximum separately; both are commonly used in the literature (Benmarhnia et al., 2015; Bunker et al., 2016; Weilnhammer et al., 2021)

        Project Summary:

        We examine the association between weather extremes and persons buried in the nation’s largest indigent burial ground—Hart Island, New York, where more than one million unclaimed individuals are interred. Public burial records provide a window into mortality among particularly vulnerable populations. We connect public-burial deaths with extreme temperatures, and precipitation, in first of their kind analyses. This study takes place in two parts.

        In the first part of the analysis, we link New York City daily air and wet bulb temperature patterns for the period 1977-2022 to daily deaths that remain unclaimed and were subsequently buried on Hart Island. We find robust evidence linking peak summer temperatures to unclaimed mortality. On average, a 1-degree Fahrenheit (.556-degree Celsius) higher maximum peak daily air temperature in a 7-day (3-day) summer period predicts 1.2% (1%) more daily unclaimed deaths on day 7 (3), controlling for precipitation and season, year, decade and holiday effects. Further analysis suggests that 5.1% of all extreme heat related deaths were unclaimed city-wide, implying New Yorkers who died due to extreme heat were more than three times as likely to be unclaimed. (The measures based on the weather data indicated above are for this long-term analysis only.)

        In the second part of this analysis (beginning in Spring 2025), we consider the spatial variation in temperatures within New York City, for a more recent time period. That analysis will use measures of temperature based on land-surface temperature as well as air temperature in order to capture variation in the built-environment (Hrisko et al., 2020; Naserikia et al., 2023). Especially for large cities, built-environment features are considered important to understanding how people experience heat. These data will be cross-validated with a set of temperature data collected at schools, public housing campuses and selected other public locations throughout New York City (https://crest.cuny.edu/uHMT/index.html). We will integrate the spatial temperature data with geocoded unclaimed death records from Hart Island and study vulnerability hotspots and periods across New York City neighborhoods.  

        This research highlights the undue burden that climate change places on deeply vulnerable populations, and thus the need to use innovative demographic and climate data with integrated methods to better capture and understand these impacts.

        On the creation of the weather variables:

        Questions and answers supplied here have been excerpted from Heiland et al. 2025 [link forthcoming].

        Q:   Why didn’t we use long-term historical data on extreme heat that is made available by the Centers for Disease Control on extreme heat days and daily maximum summer temperatures for all counties and census tracts?
        A:   The analysis of public burial deaths (on Hart Island) examines daily temperature mins and maxes in all seasons, so we needed data that included all days, and both minima and maximum temperatures.

        Q:   Why did we choose temperature windows of 1-, 3-, 7- and 10-days?
        A:   Evidence from studies on extreme temperatures and mortality and morbidity suggest extreme temperature spells impact with a lag of up to 10 days and differential sensitivity to heat versus cold spells. While extreme temperatures can have immediate health impacts measurable in single-day models, extended exposure periods may produce additional and distinct effects beyond these immediate impacts. The most relevant exposure duration can vary significantly based on factors, such as age, access to temperature control systems, built environment, and local climate. By examining multiple time windows, we can provide sensitivity analysis to the choice of the exposure window but also determine which duration is most significant for understanding temperature effects in the Hart Island unclaimed deaths sample.

        Q:   Why choose both wet bulb and air temperature?
        A:   We examine both wet bulb and air temperature measurements because they capture different aspects of how heat affects human health. While air temperature alone is important, humidity plays a crucial role in how the body experiences and responds to heat. Heat indices like wet bulb measures combine temperature and humidity to indicate human discomfort (Anderson & Bell, 2009; Ashcroft, 2002; Oudin Åström et al., 2015). The body primarily cools itself through sweat evaporation, but high humidity reduces this cooling mechanism’s effectiveness. This is particularly relevant because humans have a physiological limit for heat tolerance at a wet bulb temperature of 35°C (Raymond et al., 2020), and certain populations, especially older adults, have a reduced ability to regulate their body temperature (Brazaitis et al., 2017; Cramer et al., 2022; Meade et al., 2020). Research suggests that there is an upper limit on heat and humidity tolerance for all mammals that could be breached in the future due to climate change (Sherwood & Huber, 2010).

        By analyzing both wet bulb and air temperature measurements, we can assess whether incorporating humidity into our temperature metrics meaningfully affects our findings for the Hart Island population. While previous research emphasizes humidity’s role in heat stress, comparing results using both metrics allows us to determine if this theoretical importance translates to practical differences in mortality patterns in our specific sample. Our analysis reveals that the relationship between temperature and mortality follows similar patterns across both measures, though the air temperature models show slightly stronger associations in magnitude.

        References:

        Adeyeye TE, Insaf TZ, Al-Hamdan MZ, Nayak SG, Stuart N, DiRienzo S, Crosson WL. Estimating policy-relevant health effects of ambient heat exposures using spatially contiguous reanalysis data. Environ Health. 2019 Apr 18;18(1):35. doi: 10.1186/s12940-019-0467-5. PMID: 30999920; PMCID: PMC6471902

        Brite, J., Heiland, F.W. and Balk, D., 2025. Understanding deep disadvantage at the end of life: A nationwide analysis of unclaimed deaths. Social Science & Medicine, 365, p.117551. https://doi.org/10.1016/j.socscimed.2024.117551

        Hrisko et al. (2020). Urban air temperature model using GOES-16 LST and a diurnal regressive neural network algorithm, Remote Sensing of the Environment https://www.sciencedirect.com/science/article/abs/pii/S0034425719305140

        Menne, M. J., Durre, I., Korzeniewski, B., McNeill, S., Thomas, K., Yin, X., Anthony, S., Ray, R., Vose, R. S., Gleason, B. E., & Houston, T. G. (2012). Global Historical Climatology Network—Daily (GHCN-Daily), Version 3 [Dataset]. NOAA National Centers for Environmental Information. https://doi.org/10.7289/V5D21VHZ

        Muñoz-Sabater, J., Dutra, E., Agustí-Panareda, A., Albergel, C., Arduini, G., Balsamo, G., Boussetta, S., Choulga, M., Harrigan, S., & Hersbach, H. (2021). ERA5-Land: A state-of-the-art global reanalysis dataset for land applications. Earth System Science Data, 13(9), 4349–4383.

        Naserikia et al. (2023). Land surface and air temperature dynamics: The role of urban form and seasonality Science of the Total Environment https://www.sciencedirect.com/science/article/pii/S0048969723059338

        New York City Department of Correction. (2024). Hart Island Lookup Service [Dataset].
        https://a073-hartisland-web.nyc.gov/hartisland/pages/home/home.jsf

        NYC OpenData. (2024). Borough Boundaries [Dataset]. https://data.cityofnewyork.us/City-Government/Borough-Boundaries/tqmj-j8zm

        Sohn, H., Timmermans, S. and Prickett, P.J., 2020. Loneliness in life and in death? Social and demographic patterns of unclaimed deaths. Plos one, 15(9), p.e0238348.

        Continue reading

        Extreme Events and Rural Older Adults

        Extreme Events and the Rural Older Adults

        Investigators:

        Lori Hunter (PI), Catherine Talbot, Helen Wilson-Burns, Dylan Connor

        Funding:

        NIA

        Data sources:

        Measures:

        • Health Measures: Several measures of physical and mental health (table below).
        • Aging Measures: Contrast health outcomes across age groups including 18-64 years and 65 years and over; also disaggregate into subcategories of younger and older individuals (e.g., 18-34, 75+).
        • Climate Measures: Extreme events (FEMA, SHELDUS); precipitation and temperature anomalies; more details below.

        Project Summary:

        This project examines the physical and mental health impacts of extreme environmental events on the elderly, with an emphasis on how these impacts vary across the rural-urban continuum. Extreme environmental events — such as floods, wildfires, and hurricanes — are increasing in frequency and severity (Hayhoe et al. 2018) and rural residents are especially vulnerable given their lower levels of health insurance coverage (Cohen et al. 2021) and lesser access to health care. Physician density is much lower in rural areas (Machado et al. 2021) and ongoing hospital closures mean longer transport times, including for emergency care (GAO 2021). In fact, rural dwellers are already subject to the “rural mortality penalty” in that they already have lower life expectancies compared to their urban counterparts (Miller and Vasan 2021). We combine data on physical and mental health from the National Health Interview Survey, historical weather data, FEMA disaster declarations, and background on the scale and scope extreme environmental events and then link these to indicators of ruralness based on the USDA’s rural-urban continuum. We emphasize the connections between extreme environmental events and health for the rural elderly by contrasting the association for this group with that for younger individuals and urban dwellers. Of additional interest is the potential for social support and connection to be protective. In urban areas, social isolation has been found to play a role in mortality in disasters such as the loss of elderly life in the Chicago heat wave of 1995 (Klinenberg 2015). However, rural areas are characterized by relatively stronger social bonds (Henning-Smith et al. 2019) and we therefore examine the possibility of such connections benefiting the rural elderly in times of disaster. In all, this project provides information important for the development of programs and policies to protect elderly health in the context of rising environmental extremes.

        Comments:

        No locational data are available in the publicly available NHIS and, as a result, restricted data were required in order to integrate the data sources. The restricted data provide county location and the social and environmental data are integrated at the county scale.

        Contrasts across rural and urban areas are central to the project, so we also include the USDA Economic Research Service’s “Rural-Urban Continuum Codes” (RUCC) that include 9 categories with 3 “metro” county classes and 6 “nonmetro” classes. Metro counties are divided into categories according to total population size of the metro area of which they are part, and nonmetro counties are categorized by the size of their urban populations and the county’s adjacency to one or more metro areas.

        On the creation of the weather variables:

        The data are integrated at the county scale, with temperatures and precipitation measures representing the average of values within a county. NOAA’s data are generated from 23,000 weather stations and vetted using National Research Council standards.  Such data allow tremendous flexibility in creation of measures of stress including heat stressors that do not rise to the definition of heat waves (defined by the EPA as at least four days with an average temperature that would only be expected to persist over four days once every 10 years, based on the historical record). Similarly, measures can be created of precipitation anomalies that do not result in floods (defined by FEMA as partial or complete inundation of 2 or more acres or 2 more properties). The research team has made use of such weather data in prior scholarship where anomalies were indicated by 1 or 2 standard deviations from a long term normal (typically 30 years). We use such measures to identify extreme events in addition to the SHELDUS and FEMA disaster data.

        Continue reading